This post contains affiliate links. As an Amazon Associate we earn from qualifying purchases, at no extra cost to you. Read our disclosure.
Safety first: This is general money education, not personalised financial advice. Please read our financial disclaimer before you start.
Key takeaways
- Pick the smallest chart that fits your goal; finishing one builds the habit.
- Save the money first, then color the box.
- Charts 1 to 4 cover $20 to $150 for tight budgets and kids.
- Charts 5 to 10 run from $250 to a $1,000 emergency fund.
- The thermometer and 1% chart work for any goal amount.
In this post7 sections
How to Use a Saving Money Chart
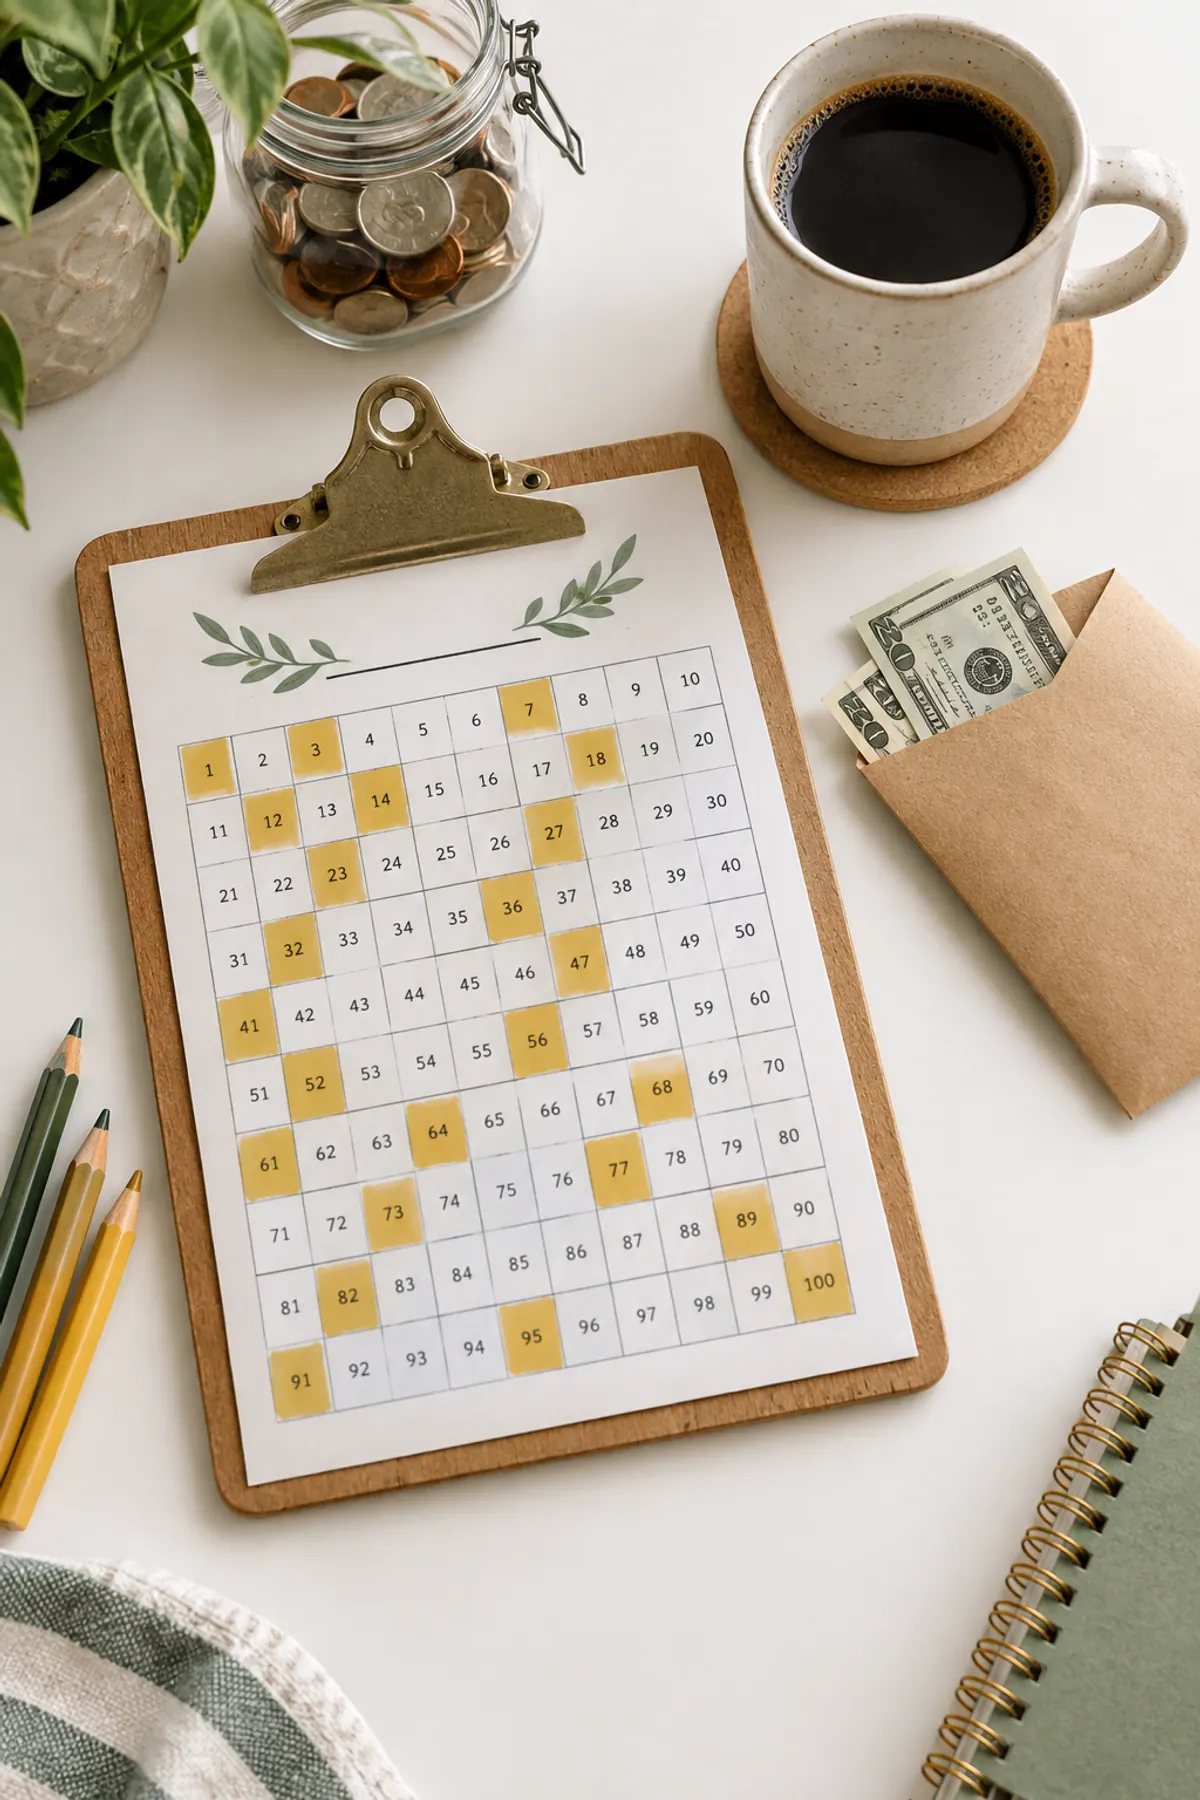
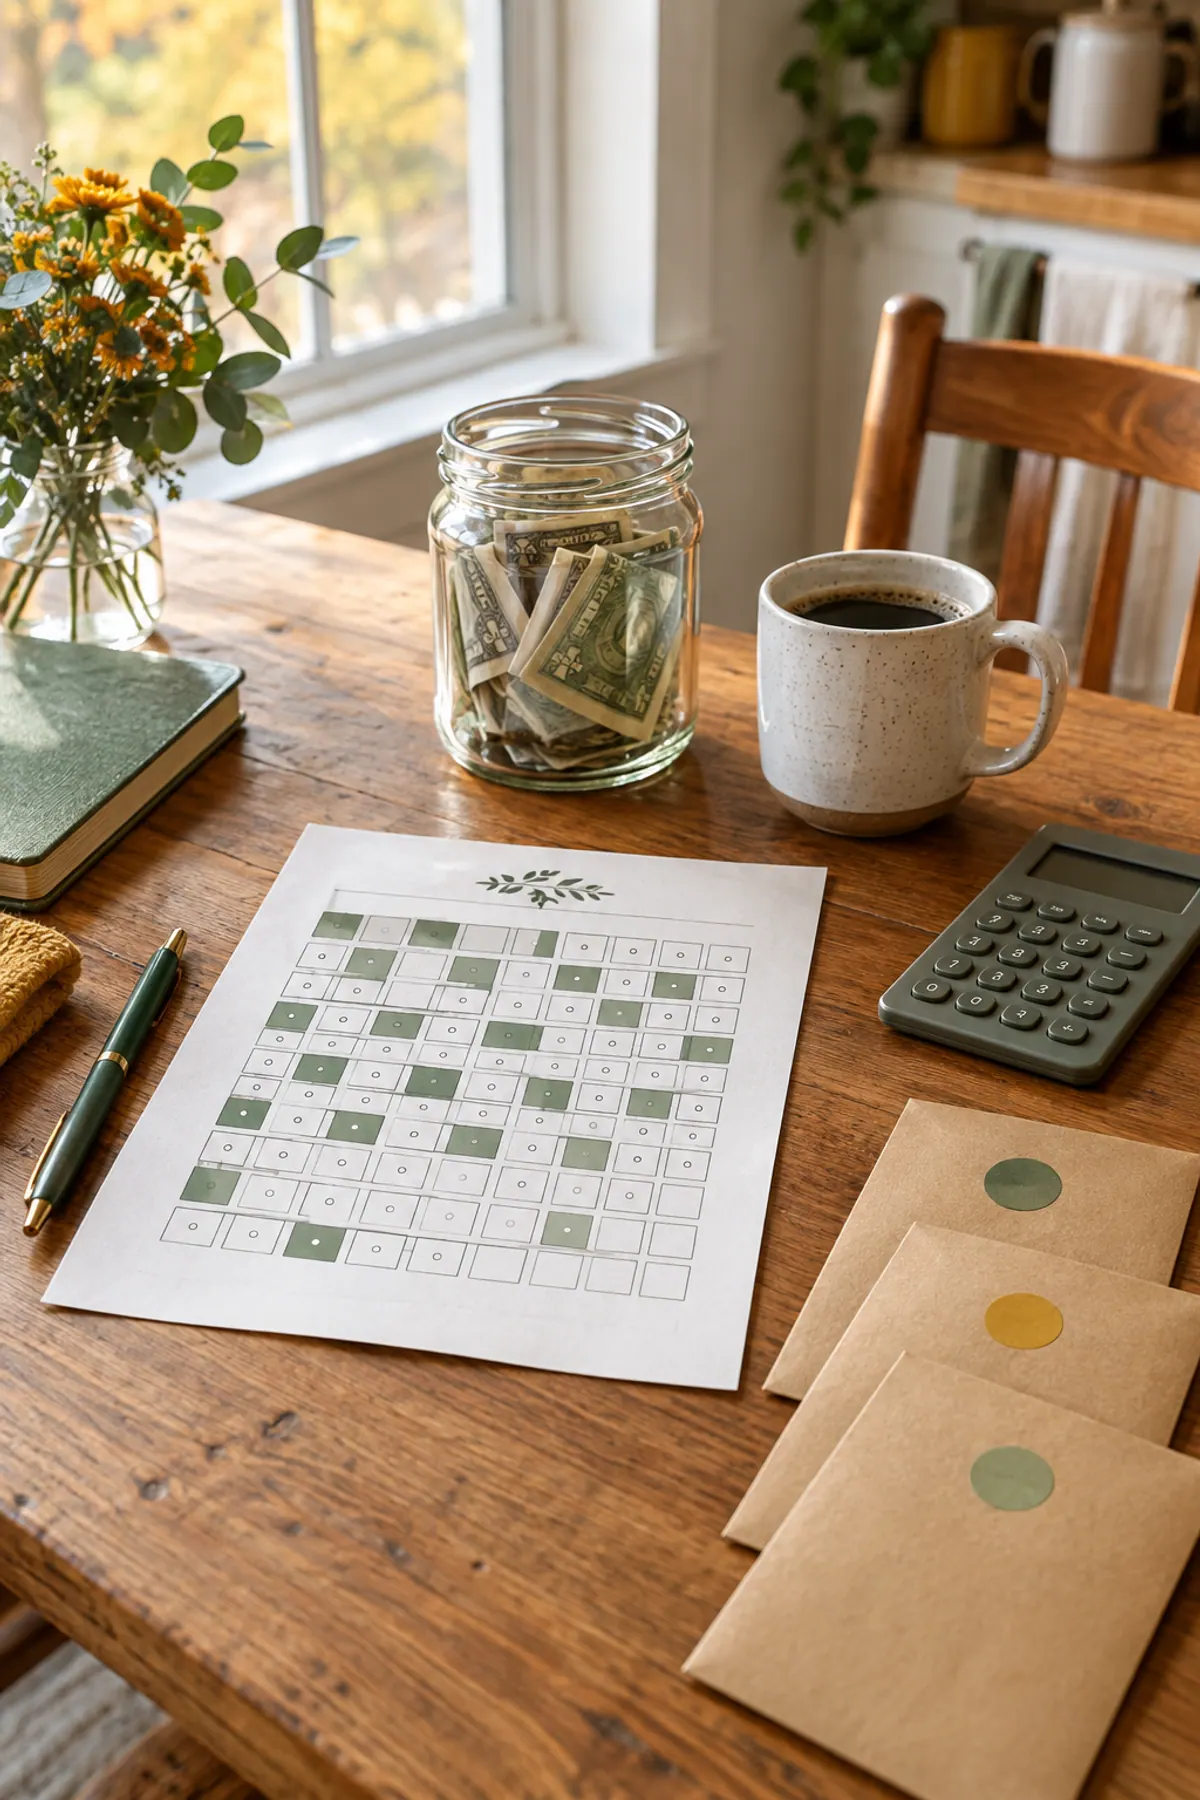
A saving money chart is a grid of boxes, and each box stands for a set amount. Every time you save that amount, you color in a box. When the grid is full, you've hit the goal.
The trick is choosing the right size. A chart that's too big sits on the fridge half-empty and starts to feel like a scolding. So the 12 savings trackers below start at $20 and $50 and build up from there.
-
Step 1: Pick a goal and a deadline
Write down what the money is for and when you need it. "$250 for car registration by March" works better than "save more."
-
Step 2: Choose the chart that fits
Find the chart closest to your goal, then check the box size against your budget. A $5 box is easy to fill on a tight week.
-
Step 3: Print it and put it where you'll see it
Use your browser's print button to print just the chart. The fridge, a budget binder or the inside of a cupboard door all work.
-
Step 4: Save first, then color
Move the money to savings or into a jar first, then color the box. That keeps the chart honest.
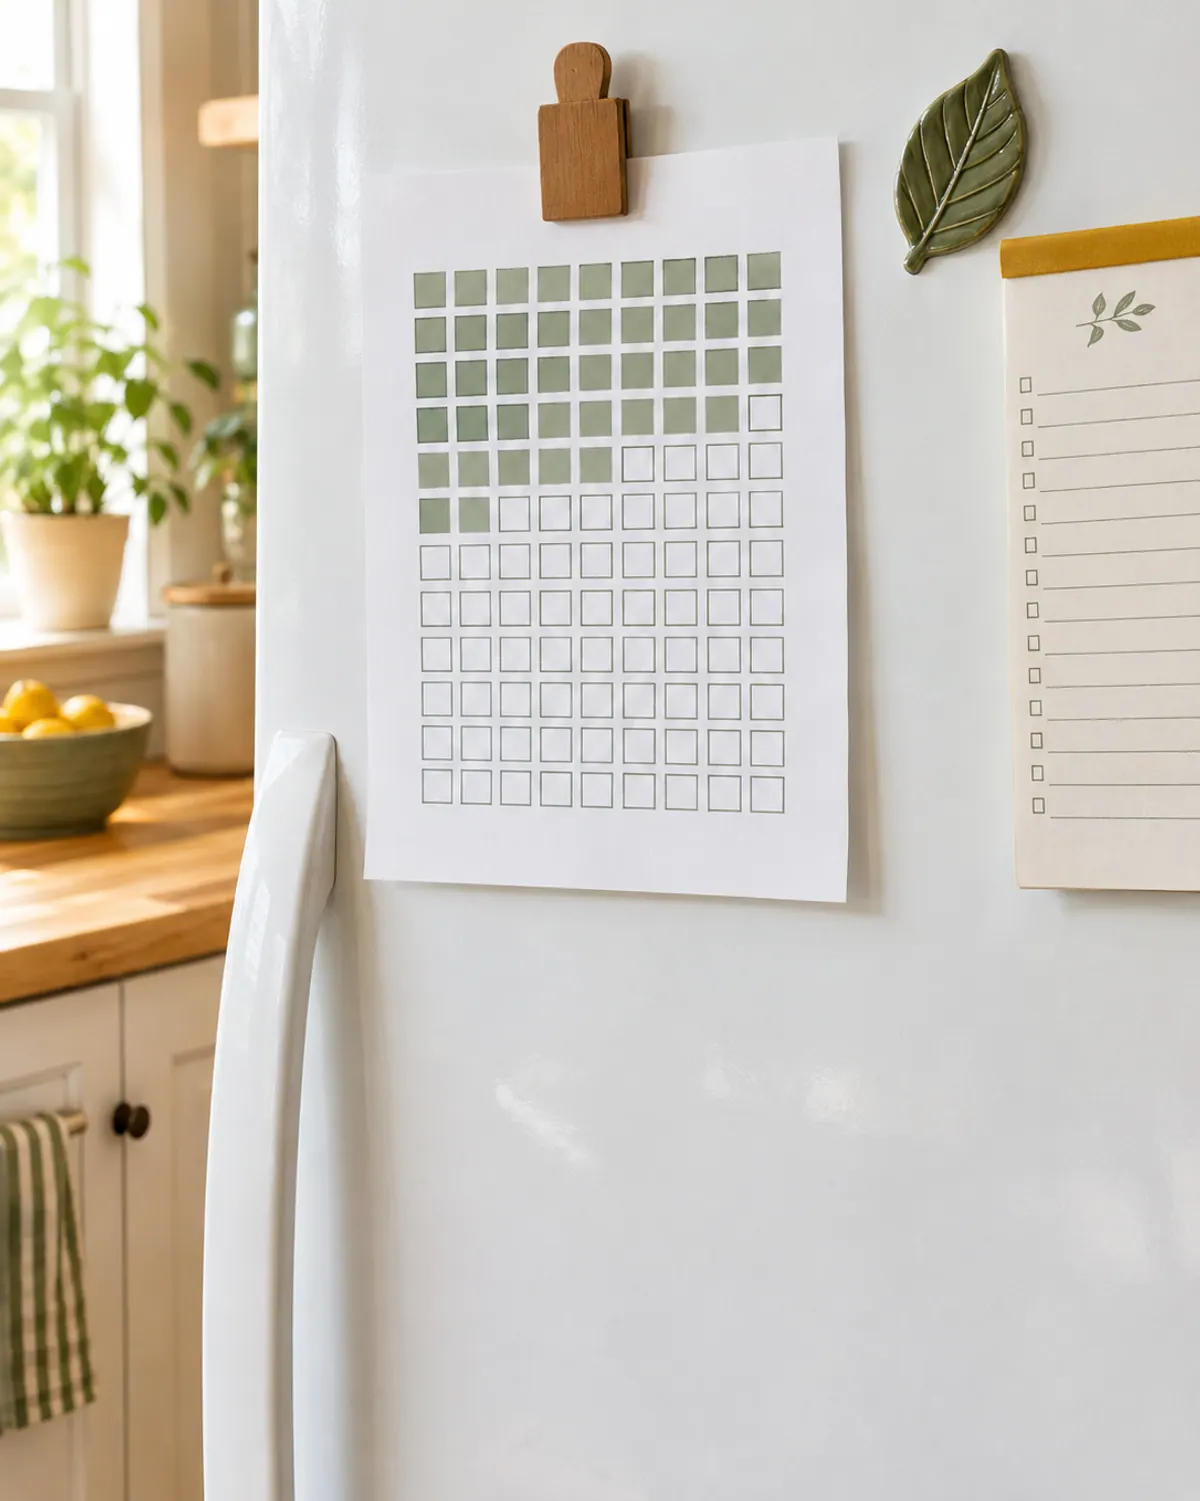
These charts are general tools with example amounts, not financial advice. See our financial disclaimer.
Small Savings Tracker Printables: $20 to $150
Start here if money is tight or you're building the habit. A small chart you finish in a few weeks does more for your motivation than a big one you never fill.
1. $50 savings tracker.
Ten boxes of $5. Many families can find $5 a few times a week by skipping one drink out or one snack run.
| Row | Color in each box | Row total | Running total |
|---|---|---|---|
| 1 | ☐ $5 ☐ $5 ☐ $5 ☐ $5 ☐ $5 | $25 | $25 |
| 2 | ☐ $5 ☐ $5 ☐ $5 ☐ $5 ☐ $5 | $25 | $50 |
2. Kids savings tracker: $20.
Twenty boxes of $1, made for a coin jar. Kids color a box each time they add a dollar in coins or bills, which makes saving something they can see.
| Row | Color in each box | Row total | Running total |
|---|---|---|---|
| 1 | ☐ $1 ☐ $1 ☐ $1 ☐ $1 ☐ $1 | $5 | $5 |
| 2 | ☐ $1 ☐ $1 ☐ $1 ☐ $1 ☐ $1 | $5 | $10 |
| 3 | ☐ $1 ☐ $1 ☐ $1 ☐ $1 ☐ $1 | $5 | $15 |
| 4 | ☐ $1 ☐ $1 ☐ $1 ☐ $1 ☐ $1 | $5 | $20 |

3. $100 savings tracker.
Twenty boxes of $5. This one fits a small goal like a school fee, a birthday or a first cushion for surprise costs.
| Row | Color in each box | Row total | Running total |
|---|---|---|---|
| 1 | ☐ $5 ☐ $5 ☐ $5 ☐ $5 ☐ $5 | $25 | $25 |
| 2 | ☐ $5 ☐ $5 ☐ $5 ☐ $5 ☐ $5 | $25 | $50 |
| 3 | ☐ $5 ☐ $5 ☐ $5 ☐ $5 ☐ $5 | $25 | $75 |
| 4 | ☐ $5 ☐ $5 ☐ $5 ☐ $5 ☐ $5 | $25 | $100 |
4. 30 day savings tracker: $5 a day.
Thirty boxes, one per day, $150 total. It's a good match for a spending-freeze week or a month when you're cutting takeout.
| Row | Color in each box | Row total | Running total |
|---|---|---|---|
| 1 | ☐ $5 ☐ $5 ☐ $5 ☐ $5 ☐ $5 | $25 | $25 |
| 2 | ☐ $5 ☐ $5 ☐ $5 ☐ $5 ☐ $5 | $25 | $50 |
| 3 | ☐ $5 ☐ $5 ☐ $5 ☐ $5 ☐ $5 | $25 | $75 |
| 4 | ☐ $5 ☐ $5 ☐ $5 ☐ $5 ☐ $5 | $25 | $100 |
| 5 | ☐ $5 ☐ $5 ☐ $5 ☐ $5 ☐ $5 | $25 | $125 |
| 6 | ☐ $5 ☐ $5 ☐ $5 ☐ $5 ☐ $5 | $25 | $150 |
Want a ready-made chart to start with? Our free savings challenge pack includes a 50-envelope chart that totals $1,275, a goal thermometer, a 30-day no-spend tracker and a blank chart you can fill in with any amounts.
Savings Trackers for $250 to $600
Once a small chart is full, a medium one is the next step. These fit goals like a car repair fund, holiday gifts or a few months of a sinking fund.
5. $250 savings tracker.
Twenty-five boxes of $10. At $20 a week, that's about three months.
| Row | Color in each box | Row total | Running total |
|---|---|---|---|
| 1 | ☐ $10 ☐ $10 ☐ $10 ☐ $10 ☐ $10 | $50 | $50 |
| 2 | ☐ $10 ☐ $10 ☐ $10 ☐ $10 ☐ $10 | $50 | $100 |
| 3 | ☐ $10 ☐ $10 ☐ $10 ☐ $10 ☐ $10 | $50 | $150 |
| 4 | ☐ $10 ☐ $10 ☐ $10 ☐ $10 ☐ $10 | $50 | $200 |
| 5 | ☐ $10 ☐ $10 ☐ $10 ☐ $10 ☐ $10 | $50 | $250 |
6. Coin jar tracker: $300.
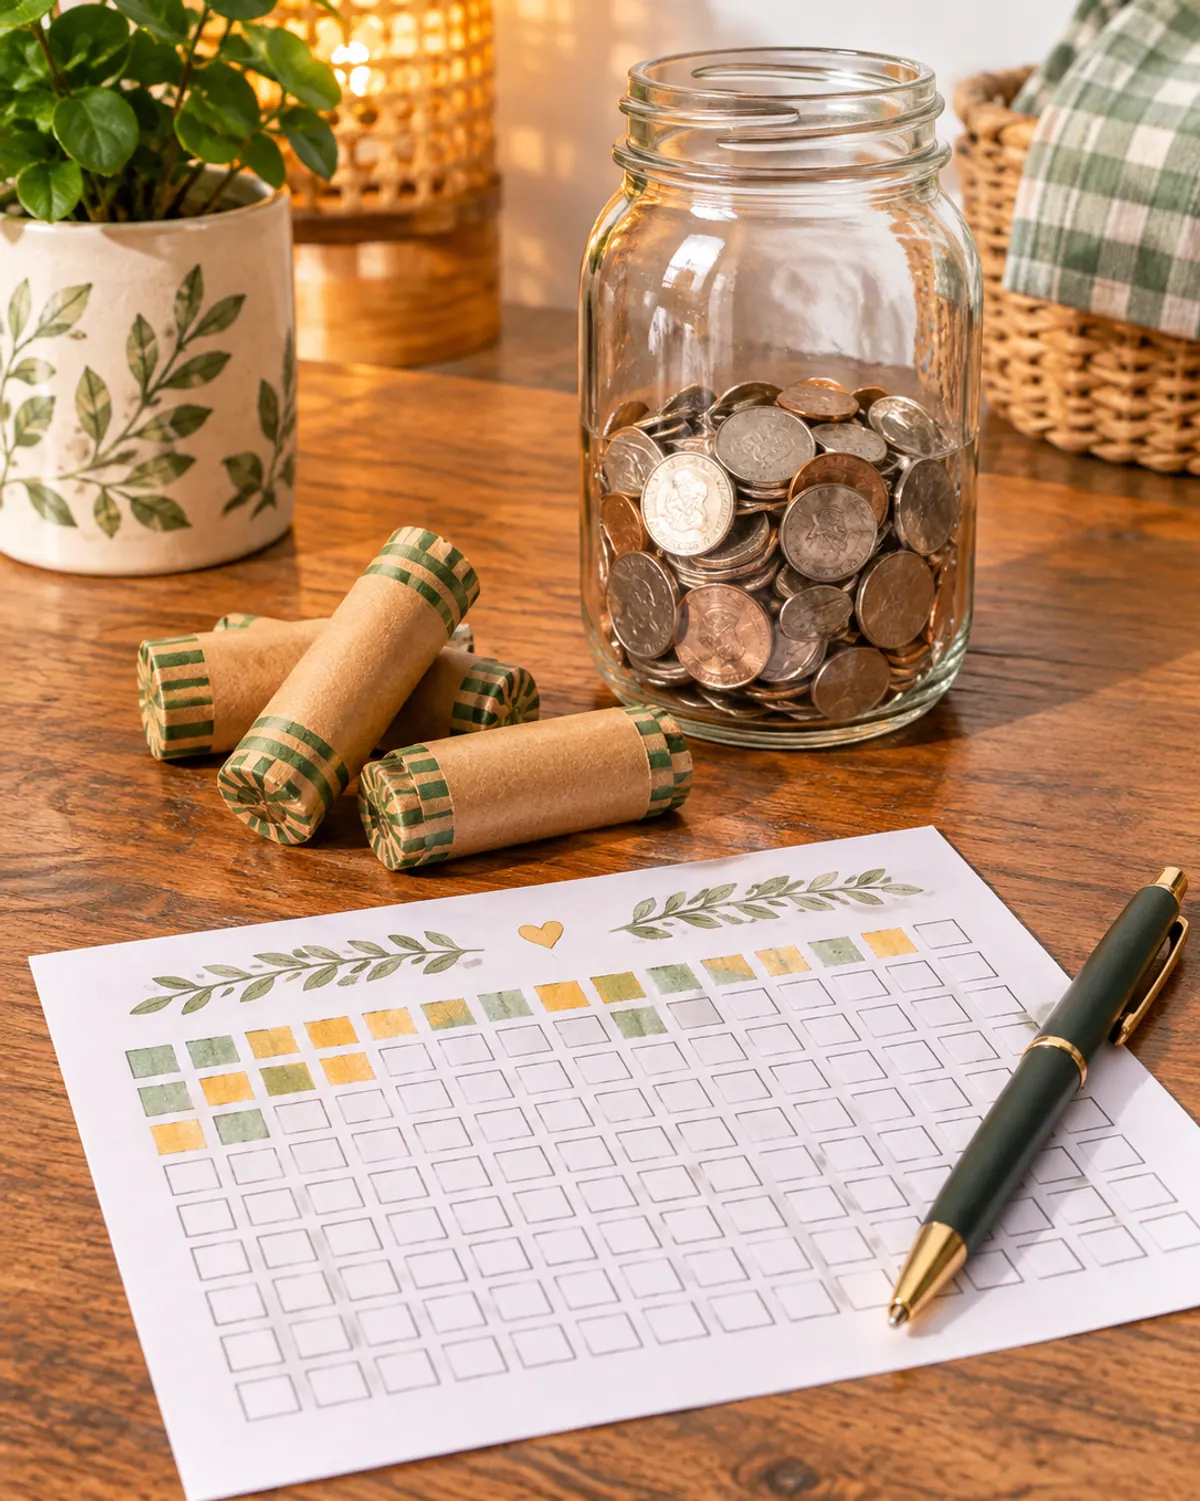
Thirty boxes, one per $10 roll of quarters. Roll the coins from your jar, color a box per roll and take the rolls to the bank.
| Row | Color in each box | Row total | Running total |
|---|---|---|---|
| 1 | ☐ $10 ☐ $10 ☐ $10 ☐ $10 ☐ $10 | $50 | $50 |
| 2 | ☐ $10 ☐ $10 ☐ $10 ☐ $10 ☐ $10 | $50 | $100 |
| 3 | ☐ $10 ☐ $10 ☐ $10 ☐ $10 ☐ $10 | $50 | $150 |
| 4 | ☐ $10 ☐ $10 ☐ $10 ☐ $10 ☐ $10 | $50 | $200 |
| 5 | ☐ $10 ☐ $10 ☐ $10 ☐ $10 ☐ $10 | $50 | $250 |
| 6 | ☐ $10 ☐ $10 ☐ $10 ☐ $10 ☐ $10 | $50 | $300 |
7. $500 savings tracker.
This chart starts with $5 boxes and grows to $10 and $20 boxes, so the early weeks feel easy. It totals $500.
| Row | Color in each box | Row total | Running total |
|---|---|---|---|
| 1 | ☐ $5 ☐ $5 ☐ $5 ☐ $5 ☐ $5 | $25 | $25 |
| 2 | ☐ $5 ☐ $5 ☐ $5 ☐ $5 ☐ $5 | $25 | $50 |
| 3 | ☐ $5 ☐ $5 ☐ $5 ☐ $5 ☐ $5 | $25 | $75 |
| 4 | ☐ $5 ☐ $5 ☐ $5 ☐ $5 ☐ $5 | $25 | $100 |
| 5 | ☐ $10 ☐ $10 ☐ $10 ☐ $10 ☐ $10 | $50 | $150 |
| 6 | ☐ $10 ☐ $10 ☐ $10 ☐ $10 ☐ $10 | $50 | $200 |
| 7 | ☐ $10 ☐ $10 ☐ $10 ☐ $10 ☐ $10 | $50 | $250 |
| 8 | ☐ $10 ☐ $10 ☐ $10 ☐ $10 ☐ $10 | $50 | $300 |
| 9 | ☐ $20 ☐ $20 ☐ $20 ☐ $20 ☐ $20 | $100 | $400 |
| 10 | ☐ $20 ☐ $20 ☐ $20 ☐ $20 ☐ $20 | $100 | $500 |
8. Weekly savings tracker: $10 a week.
Fifty-two boxes, one per week, for $520 by the end of the year. Each row is about one month.
| Row | Color in each box | Row total | Running total |
|---|---|---|---|
| 1 | ☐ $10 ☐ $10 ☐ $10 ☐ $10 | $40 | $40 |
| 2 | ☐ $10 ☐ $10 ☐ $10 ☐ $10 | $40 | $80 |
| 3 | ☐ $10 ☐ $10 ☐ $10 ☐ $10 | $40 | $120 |
| 4 | ☐ $10 ☐ $10 ☐ $10 ☐ $10 | $40 | $160 |
| 5 | ☐ $10 ☐ $10 ☐ $10 ☐ $10 | $40 | $200 |
| 6 | ☐ $10 ☐ $10 ☐ $10 ☐ $10 | $40 | $240 |
| 7 | ☐ $10 ☐ $10 ☐ $10 ☐ $10 | $40 | $280 |
| 8 | ☐ $10 ☐ $10 ☐ $10 ☐ $10 | $40 | $320 |
| 9 | ☐ $10 ☐ $10 ☐ $10 ☐ $10 | $40 | $360 |
| 10 | ☐ $10 ☐ $10 ☐ $10 ☐ $10 | $40 | $400 |
| 11 | ☐ $10 ☐ $10 ☐ $10 ☐ $10 | $40 | $440 |
| 12 | ☐ $10 ☐ $10 ☐ $10 ☐ $10 | $40 | $480 |
| 13 | ☐ $10 ☐ $10 ☐ $10 ☐ $10 | $40 | $520 |
9. Monthly savings tracker: $50 a month.
Twelve boxes, one per month, for $600 in a year. It's a good fit for a yearly bill like car insurance or next Christmas.
| Month | Saved | Running total |
|---|---|---|
| January | ☐ $50 | $50 |
| February | ☐ $50 | $100 |
| March | ☐ $50 | $150 |
| April | ☐ $50 | $200 |
| May | ☐ $50 | $250 |
| June | ☐ $50 | $300 |
| July | ☐ $50 | $350 |
| August | ☐ $50 | $400 |
| September | ☐ $50 | $450 |
| October | ☐ $50 | $500 |
| November | ☐ $50 | $550 |
| December | ☐ $50 | $600 |
For bigger charts on a weekly or paycheck schedule, our savings challenge printables cover the 52 week challenge and the $10K version, and our bi weekly savings challenges match a chart to every paycheck.
Savings Tracker for $1,000 and Any-Goal Charts
10. $1,000 emergency fund tracker.
Forty boxes of $25. A $1,000 starter emergency fund is a common first big goal, and this chart breaks it into steps you can fill on payday.
| Row | Color in each box | Row total | Running total |
|---|---|---|---|
| 1 | ☐ $25 ☐ $25 ☐ $25 ☐ $25 ☐ $25 | $125 | $125 |
| 2 | ☐ $25 ☐ $25 ☐ $25 ☐ $25 ☐ $25 | $125 | $250 |
| 3 | ☐ $25 ☐ $25 ☐ $25 ☐ $25 ☐ $25 | $125 | $375 |
| 4 | ☐ $25 ☐ $25 ☐ $25 ☐ $25 ☐ $25 | $125 | $500 |
| 5 | ☐ $25 ☐ $25 ☐ $25 ☐ $25 ☐ $25 | $125 | $625 |
| 6 | ☐ $25 ☐ $25 ☐ $25 ☐ $25 ☐ $25 | $125 | $750 |
| 7 | ☐ $25 ☐ $25 ☐ $25 ☐ $25 ☐ $25 | $125 | $875 |
| 8 | ☐ $25 ☐ $25 ☐ $25 ☐ $25 ☐ $25 | $125 | $1,000 |
Example fill-in: say a household saves $50 every two weeks. That's two boxes per payday, and the chart is full after 20 paydays, or about 40 weeks. Adding a $100 tax refund fills four more boxes at once. Our plan to save $1,000 in 30 days shows a faster route if you need it sooner.
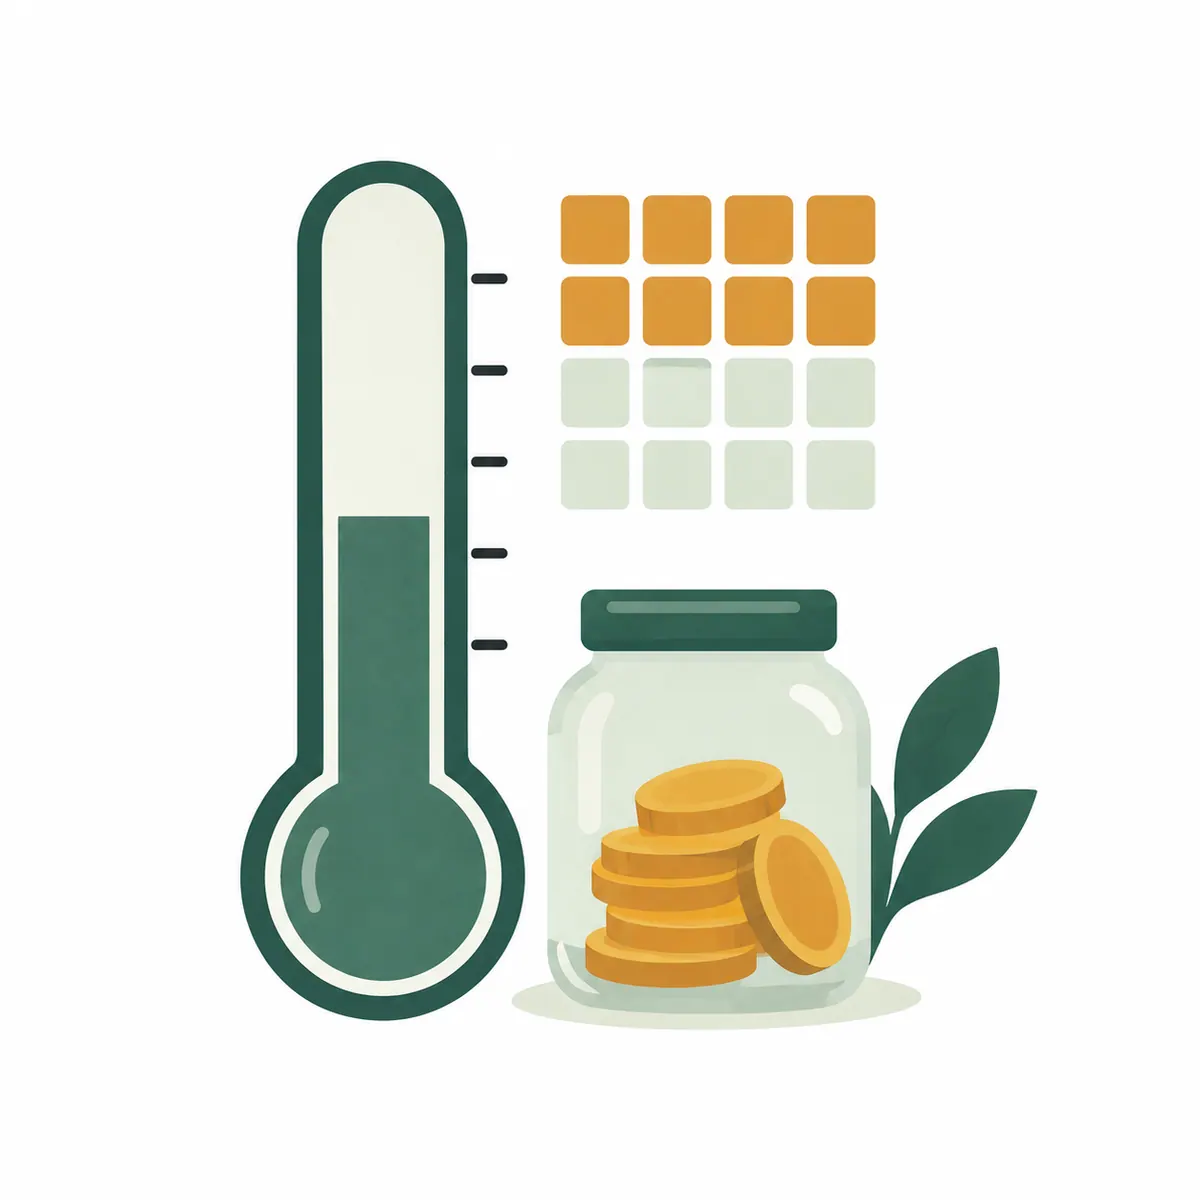
11. Savings thermometer: any goal.
A thermometer works for any amount. Write your goal at the top, divide it by 10, and fill in one band each time you reach the next step.
| Band | Percent | Example: $800 goal | Your goal |
|---|---|---|---|
| ☐ 10 | 100% | $800 | |
| ☐ 9 | 90% | $720 | |
| ☐ 8 | 80% | $640 | |
| ☐ 7 | 70% | $560 | |
| ☐ 6 | 60% | $480 | |
| ☐ 5 | 50% | $400 | |
| ☐ 4 | 40% | $320 | |
| ☐ 3 | 30% | $240 | |
| ☐ 2 | 20% | $160 | |
| ☐ 1 | 10% | $80 |
12. 1% savings chart.
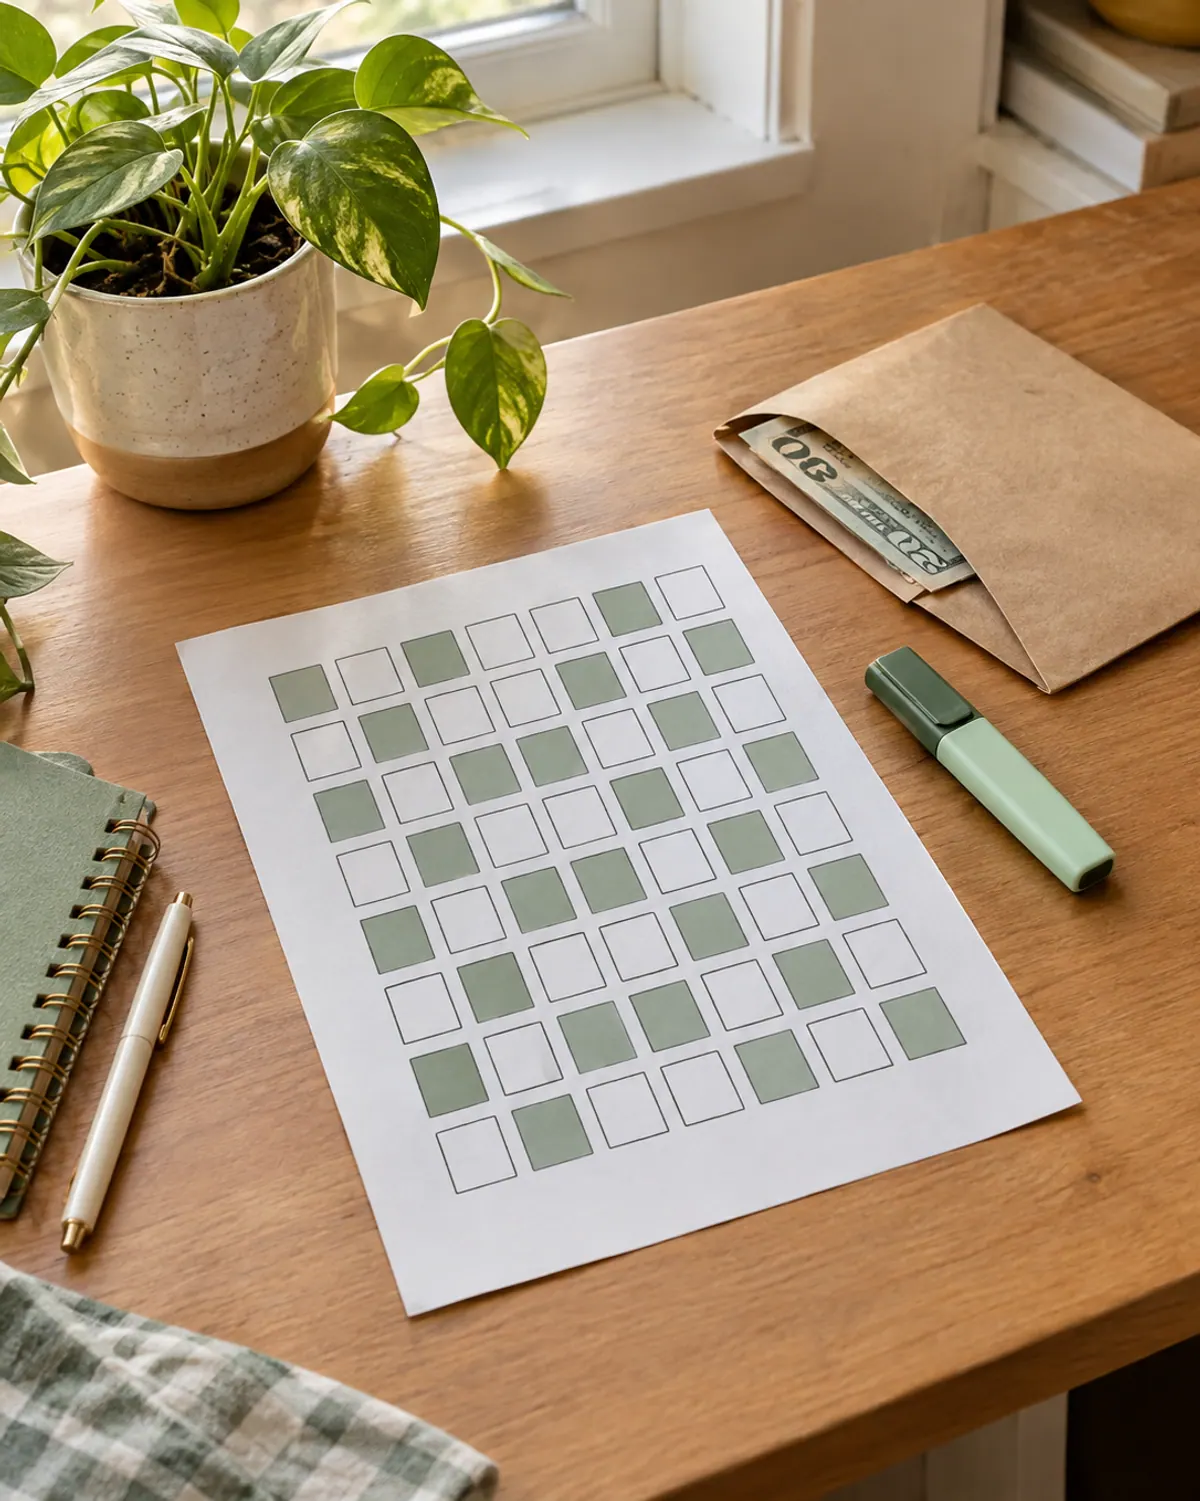
One hundred boxes, each worth 1% of your goal. For a $2,500 goal, every box is $25 and every row is $250. It's flexible: use the same chart for any goal by changing the box value.
| Row | Color in each box | Percent done |
|---|---|---|
| 1 | ☐ ☐ ☐ ☐ ☐ ☐ ☐ ☐ ☐ ☐ | 10% |
| 2 | ☐ ☐ ☐ ☐ ☐ ☐ ☐ ☐ ☐ ☐ | 20% |
| 3 | ☐ ☐ ☐ ☐ ☐ ☐ ☐ ☐ ☐ ☐ | 30% |
| 4 | ☐ ☐ ☐ ☐ ☐ ☐ ☐ ☐ ☐ ☐ | 40% |
| 5 | ☐ ☐ ☐ ☐ ☐ ☐ ☐ ☐ ☐ ☐ | 50% |
| 6 | ☐ ☐ ☐ ☐ ☐ ☐ ☐ ☐ ☐ ☐ | 60% |
| 7 | ☐ ☐ ☐ ☐ ☐ ☐ ☐ ☐ ☐ ☐ | 70% |
| 8 | ☐ ☐ ☐ ☐ ☐ ☐ ☐ ☐ ☐ ☐ | 80% |
| 9 | ☐ ☐ ☐ ☐ ☐ ☐ ☐ ☐ ☐ ☐ | 90% |
| 10 | ☐ ☐ ☐ ☐ ☐ ☐ ☐ ☐ ☐ ☐ | 100% |
Make Your Savings Tracker Stick
Color in right away.
The moment the money moves, color the box. Waiting until the weekend is how charts fall behind.
Keep the money somewhere separate.
A jar works for kids and coins. For anything bigger, a separate savings account keeps it from blending into the grocery money.
Use one chart at a time.
Two or three charts at once splits your focus. Finish one, then print the next size up.
Make it pretty if that helps.
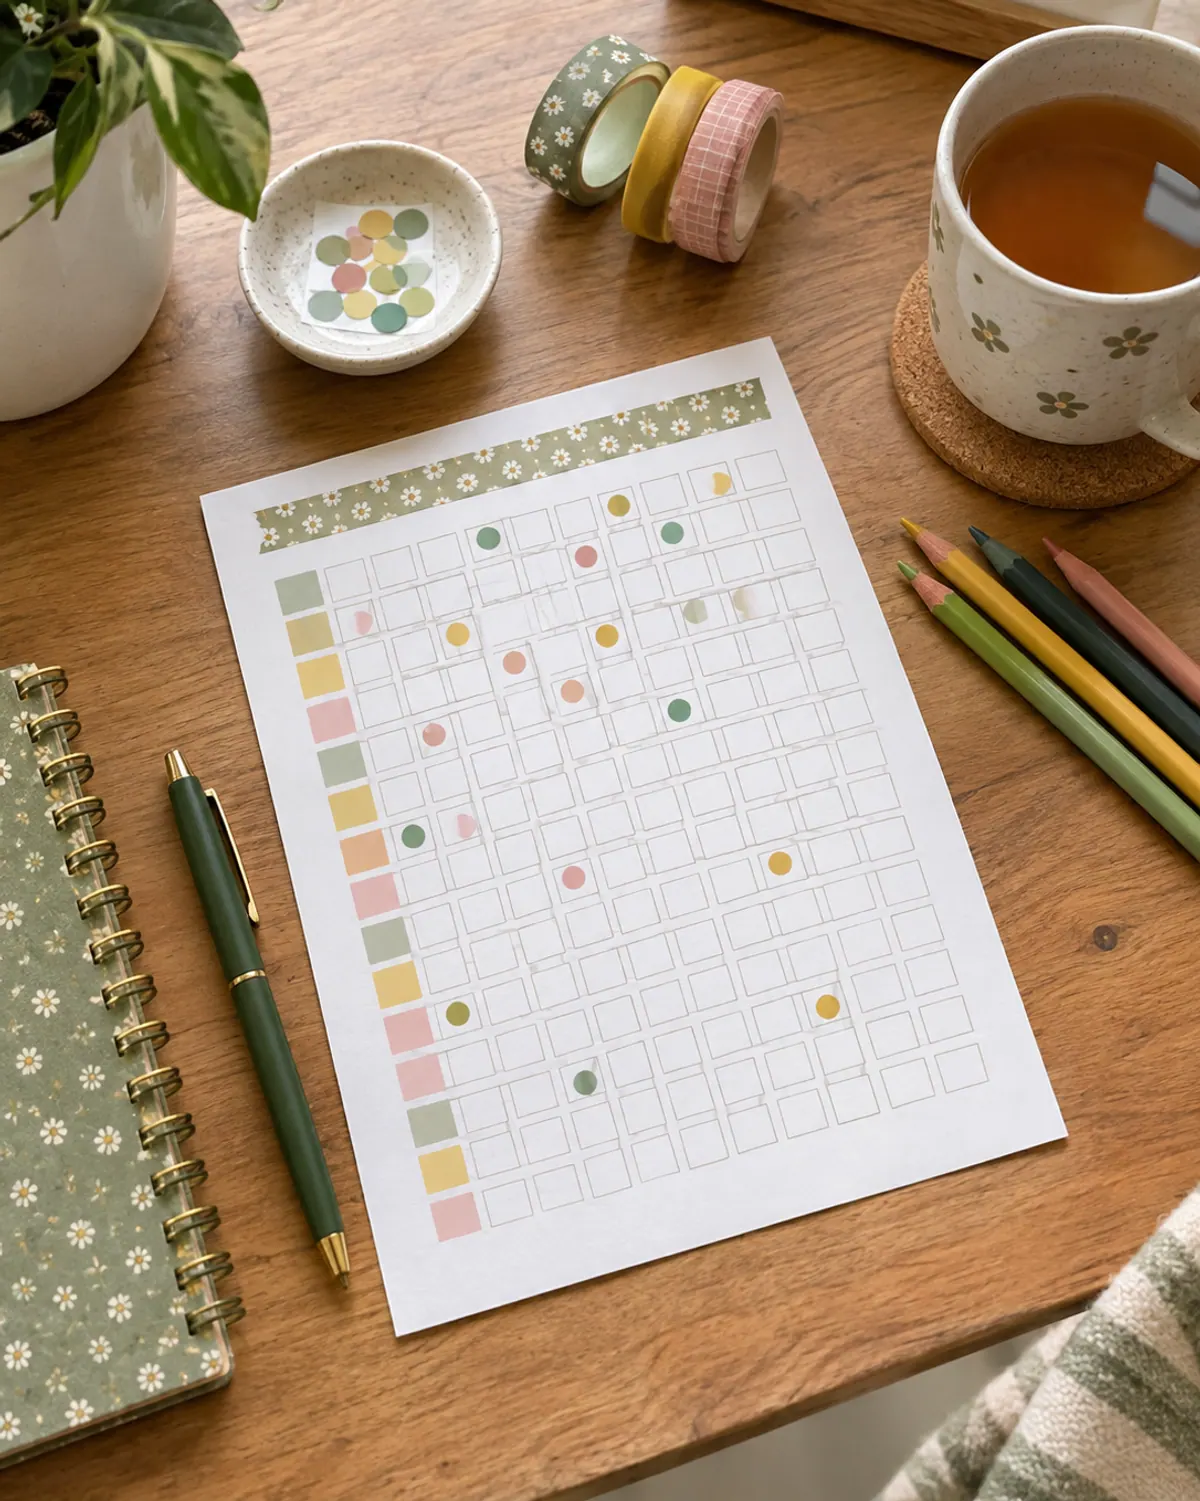
Color coding, washi tape or stickers make the chart something you want to look at. Our saving money aesthetic ideas have more ways to make it feel cozy.
Simple supplies for savings trackers
-
Pastel highlighter set
Typically $5 to $14
For coloring in boxes so the chart is easy to read across the room.
Check price on Amazon for Pastel highlighter set -
A6 or A5 budget binder
Typically $10 to $22
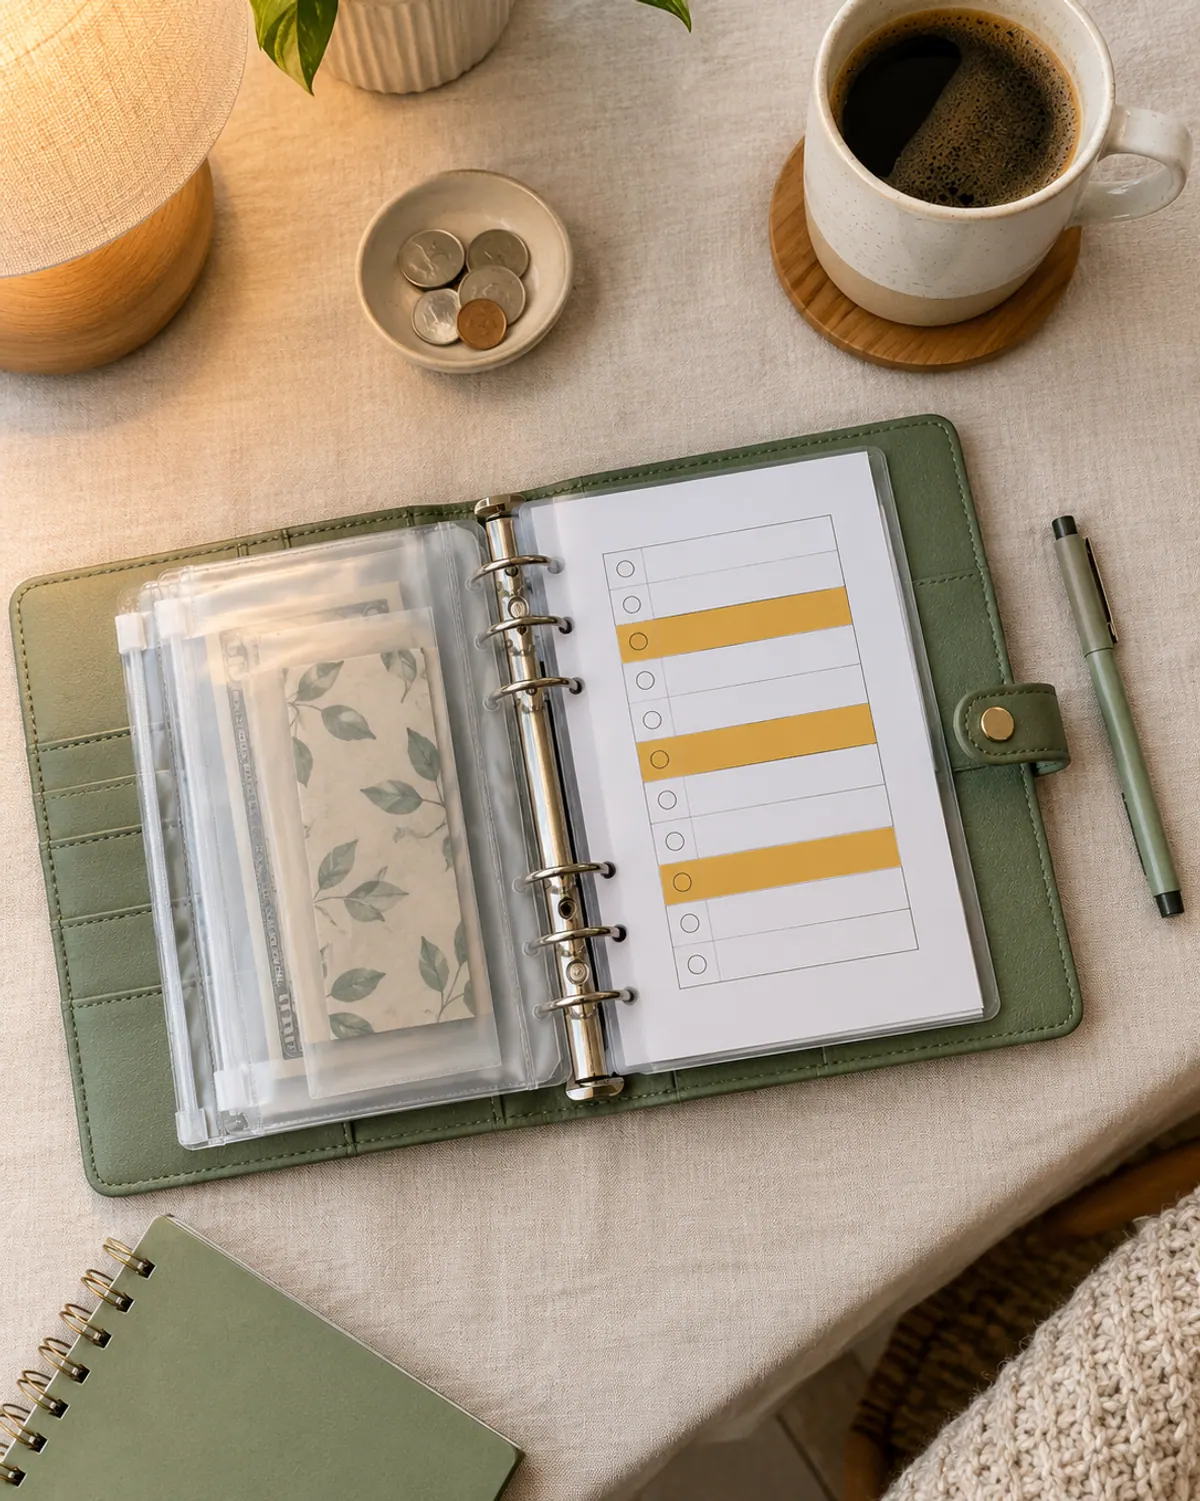
Keeps a small chart and cash envelopes together.
Check price on Amazon for A6 or A5 budget binder -
Clear coin jar
Typically $10 to $20
Lets kids see the coins pile up next to their chart.
Check price on Amazon for Clear coin jar -
Magnetic fridge clip or clipboard
Typically $6 to $15
Holds the chart where everyone sees it daily.
Check price on Amazon for Magnetic fridge clip or clipboard
More Savings Charts in the Bundle
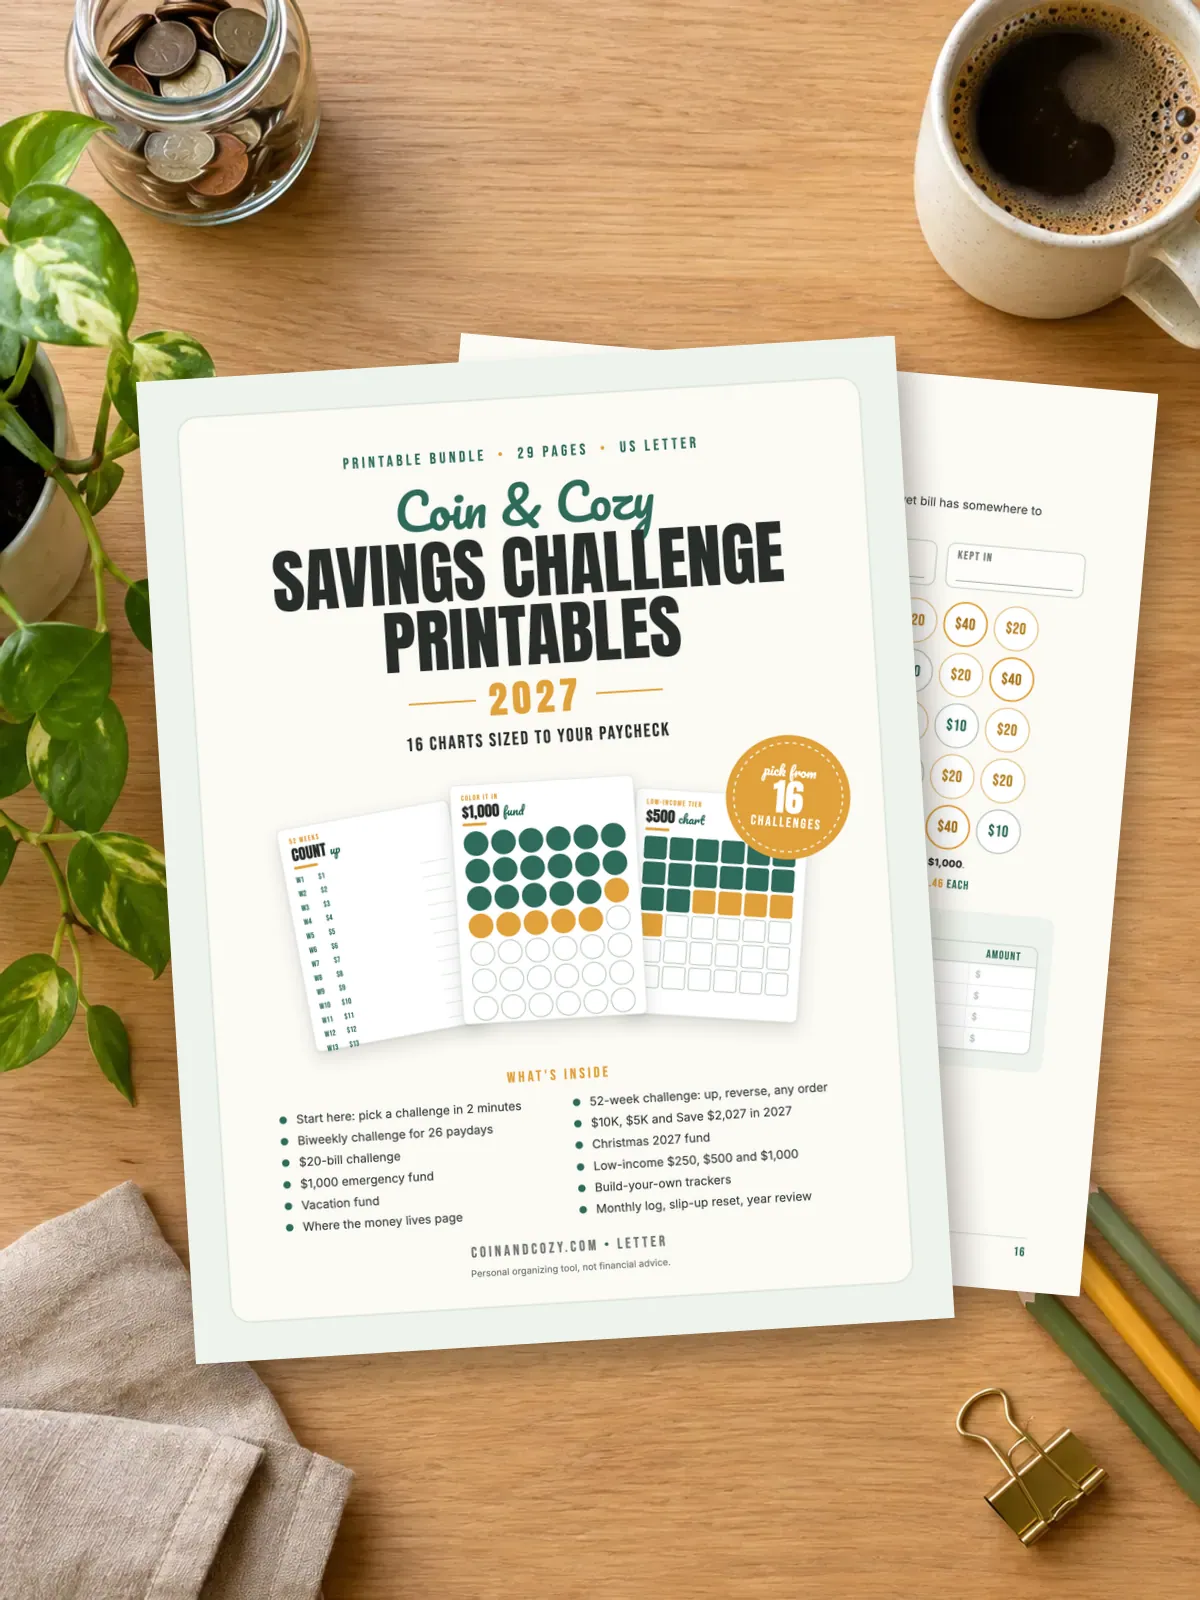
Ready for a bigger goal? The Cozy Savings Challenge Bundle 2027 is 29 pages of savings charts, with $250, $500 and $1,000 small-box charts, goal charts for a $1,000 emergency fund, Christmas 2027 and a vacation, a 52-week chart, $5K and $10K charts, and two blank build-your-own pages. It comes in Letter, A4, low-ink and A6 versions.
Pick the smallest chart that fits your goal, print it tonight and color in the first box this week. Then print the next size up when it's full.
Frequently asked questions
How do I make a savings chart?
Pick a goal, decide on a box size you can save often, and divide the goal by that amount to get the number of boxes. Draw them in rows and color one each time you save.
What is the best savings tracker printable?
The best one is the size you'll finish. If money is tight, start with the $50 or $100 chart, then move up to $250, $500 or $1,000.
How does a 1% savings chart work?
It has 100 boxes, and each box is 1% of your goal. For a $2,500 goal, each box is $25. You color one box each time you save that amount.
What is a savings thermometer?
It's a chart shaped like a thermometer, split into 10 bands. Each band is 10% of your goal, and you fill it in from the bottom as you save.
Is there a free savings tracker for $1,000?
Yes. Chart 10 on this page has 40 boxes of $25 for a $1,000 emergency fund, and it prints from your browser.
How do you track savings monthly on paper?
Use a monthly tracker like Chart 9 with one box per month, or log each deposit and its running total on one page. Check it on the same day each month.
Save it for later
Pin this to your Budget Printables board so it's there when you need it.
Save to Pinterest