This post contains affiliate links. As an Amazon Associate we earn from qualifying purchases, at no extra cost to you. Read our disclosure.
Safety first: This is general money education, not personalised financial advice. Please read our financial disclaimer before you start.
Key takeaways
- The classic 52 week savings challenge saves $1,378 ($1 + $2 + ... + $52).
- A bi weekly chart that adds $5 each paycheck saves $1,755 over 26 paychecks.
- The $10K challenge takes about $192.31 a week for a year, or $96.15 a week over two years.
- The reverse version keeps the same total but makes December the lightest month.
- Pick the chart whose biggest deposit you could make in a hard month.
In this post11 sections
- How a Savings Challenge Works
- Pick Your Savings Challenge Printable
- The 52 Week Savings Challenge Chart ($1,378)
- Reverse 52 Week Challenge for a Lighter December
- Bi Weekly Savings Challenge Chart ($1,755)
- $10K Savings Challenge Printable Math
- How to Print and Use Your Chart
- Cash Envelopes, Jars or a Savings Account?
- Tips to Finish Your Savings Challenge
- Get the Free 100 Envelope Savings Challenge Pack
- FAQ
How a Savings Challenge Works
A savings challenge is a simple game with your own money: you follow a chart, set aside a planned amount on a schedule and color in a box each time. The chart does the deciding for you, which is why it sticks when a vague "save more" plan doesn't.
Every chart on this page is a table you can print straight from your browser. Pick the one that fits your paycheck, not the one with the biggest number at the bottom.
These are examples to help you plan, not financial advice. If money is tight right now, a small chart you finish beats a big one you quit in March. Our financial disclaimer has the details.
Pick Your Savings Challenge Printable
Here's how the most popular versions compare. The totals use simple sums, so you can check them yourself with a phone calculator.
| Challenge | How it works | Math | Total |
|---|---|---|---|
| 52 week (classic) | Save $1 in week 1, $2 in week 2, up to $52 | 52 x 53 / 2 | $1,378 |
| 52 week, half size | Save $0.50, then $1.00, up to $26 | $1,378 / 2 | $689 |
| 52 week, double | Save $2, then $4, up to $104 | $1,378 x 2 | $2,756 |
| Flat weekly | Save $25 every week | $25 x 52 | $1,300 |
| Bi weekly flat | Save $50 every paycheck | $50 x 26 | $1,300 |
| Bi weekly $5 steps | Save $5, $10, $15, up to $130 | 5 x (26 x 27 / 2) | $1,755 |
| Bi weekly $10 steps | Save $10, $20, up to $260 | 10 x (26 x 27 / 2) | $3,510 |
| 50 envelope | Envelopes numbered $1 to $50 | 50 x 51 / 2 | $1,275 |
| 100 envelope | Envelopes numbered $1 to $100 | 100 x 101 / 2 | $5,050 |
The trick behind the step-up charts is a classic shortcut: adding 1 + 2 + 3 all the way to 52 equals 52 x 53 / 2, which is $1,378. The same rule gives $1,275 for 50 envelopes and $5,050 for 100 envelopes.

The 52 Week Savings Challenge Chart ($1,378)
This is the classic. In week 1 you save $1, in week 2 you save $2, and so on until week 52, when you save $52. The running total column shows where you should be, so you always know if you are on track.
The first months feel easy, which builds the habit. The catch is the end of the year: weeks 44 to 52 ask for $44 to $52 each, right when holiday spending peaks.
| Week | Deposit | Total | Week | Deposit | Total |
|---|---|---|---|---|---|
| 1 | $1 | $1 | 27 | $27 | $378 |
| 2 | $2 | $3 | 28 | $28 | $406 |
| 3 | $3 | $6 | 29 | $29 | $435 |
| 4 | $4 | $10 | 30 | $30 | $465 |
| 5 | $5 | $15 | 31 | $31 | $496 |
| 6 | $6 | $21 | 32 | $32 | $528 |
| 7 | $7 | $28 | 33 | $33 | $561 |
| 8 | $8 | $36 | 34 | $34 | $595 |
| 9 | $9 | $45 | 35 | $35 | $630 |
| 10 | $10 | $55 | 36 | $36 | $666 |
| 11 | $11 | $66 | 37 | $37 | $703 |
| 12 | $12 | $78 | 38 | $38 | $741 |
| 13 | $13 | $91 | 39 | $39 | $780 |
| 14 | $14 | $105 | 40 | $40 | $820 |
| 15 | $15 | $120 | 41 | $41 | $861 |
| 16 | $16 | $136 | 42 | $42 | $903 |
| 17 | $17 | $153 | 43 | $43 | $946 |
| 18 | $18 | $171 | 44 | $44 | $990 |
| 19 | $19 | $190 | 45 | $45 | $1,035 |
| 20 | $20 | $210 | 46 | $46 | $1,081 |
| 21 | $21 | $231 | 47 | $47 | $1,128 |
| 22 | $22 | $253 | 48 | $48 | $1,176 |
| 23 | $23 | $276 | 49 | $49 | $1,225 |
| 24 | $24 | $300 | 50 | $50 | $1,275 |
| 25 | $25 | $325 | 51 | $51 | $1,326 |
| 26 | $26 | $351 | 52 | $52 | $1,378 |
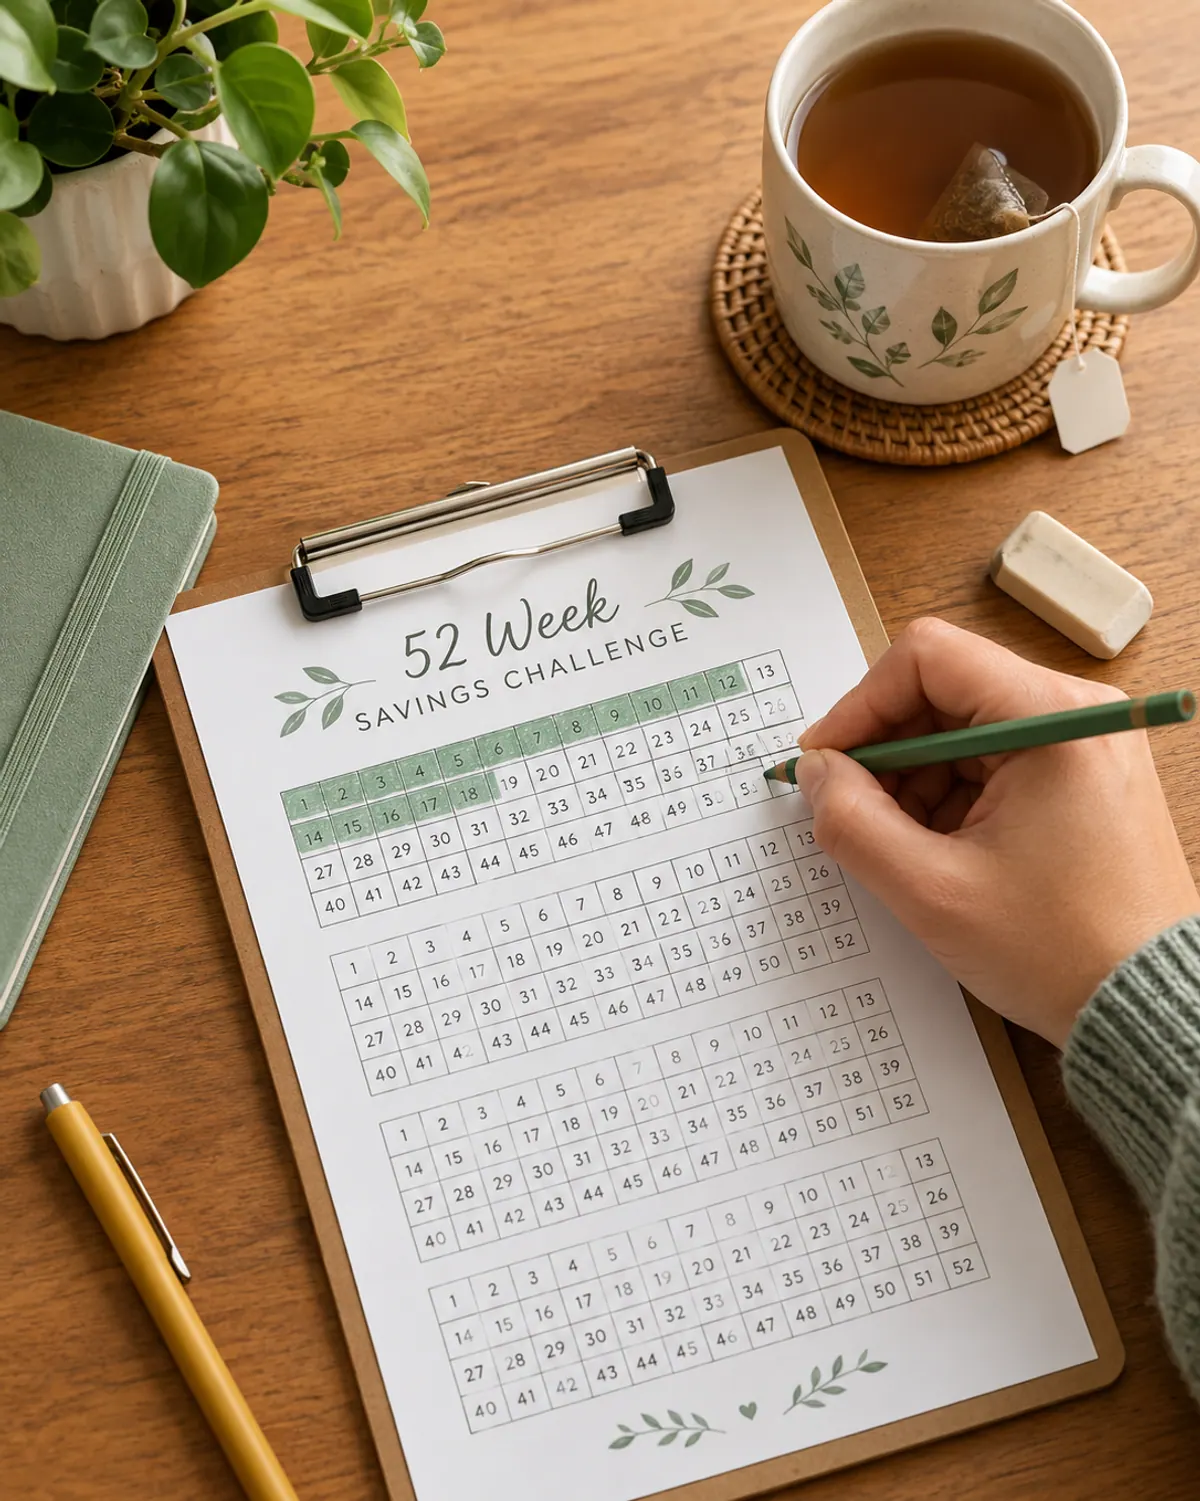
Half size and double versions use the same chart. For half size, read each deposit as half (week 10 becomes $5). For double, multiply by two (week 10 becomes $20).
Reverse 52 Week Challenge for a Lighter December
If the December stretch worries you, flip the chart. Start with $52 in week 1 and count down, so the last weeks of the year ask for only a few dollars each.
The total is still $1,378, because you are adding the same 52 numbers in a different order. Many people start the reverse version in January, when there is fresh motivation and less spending than in the holiday season.
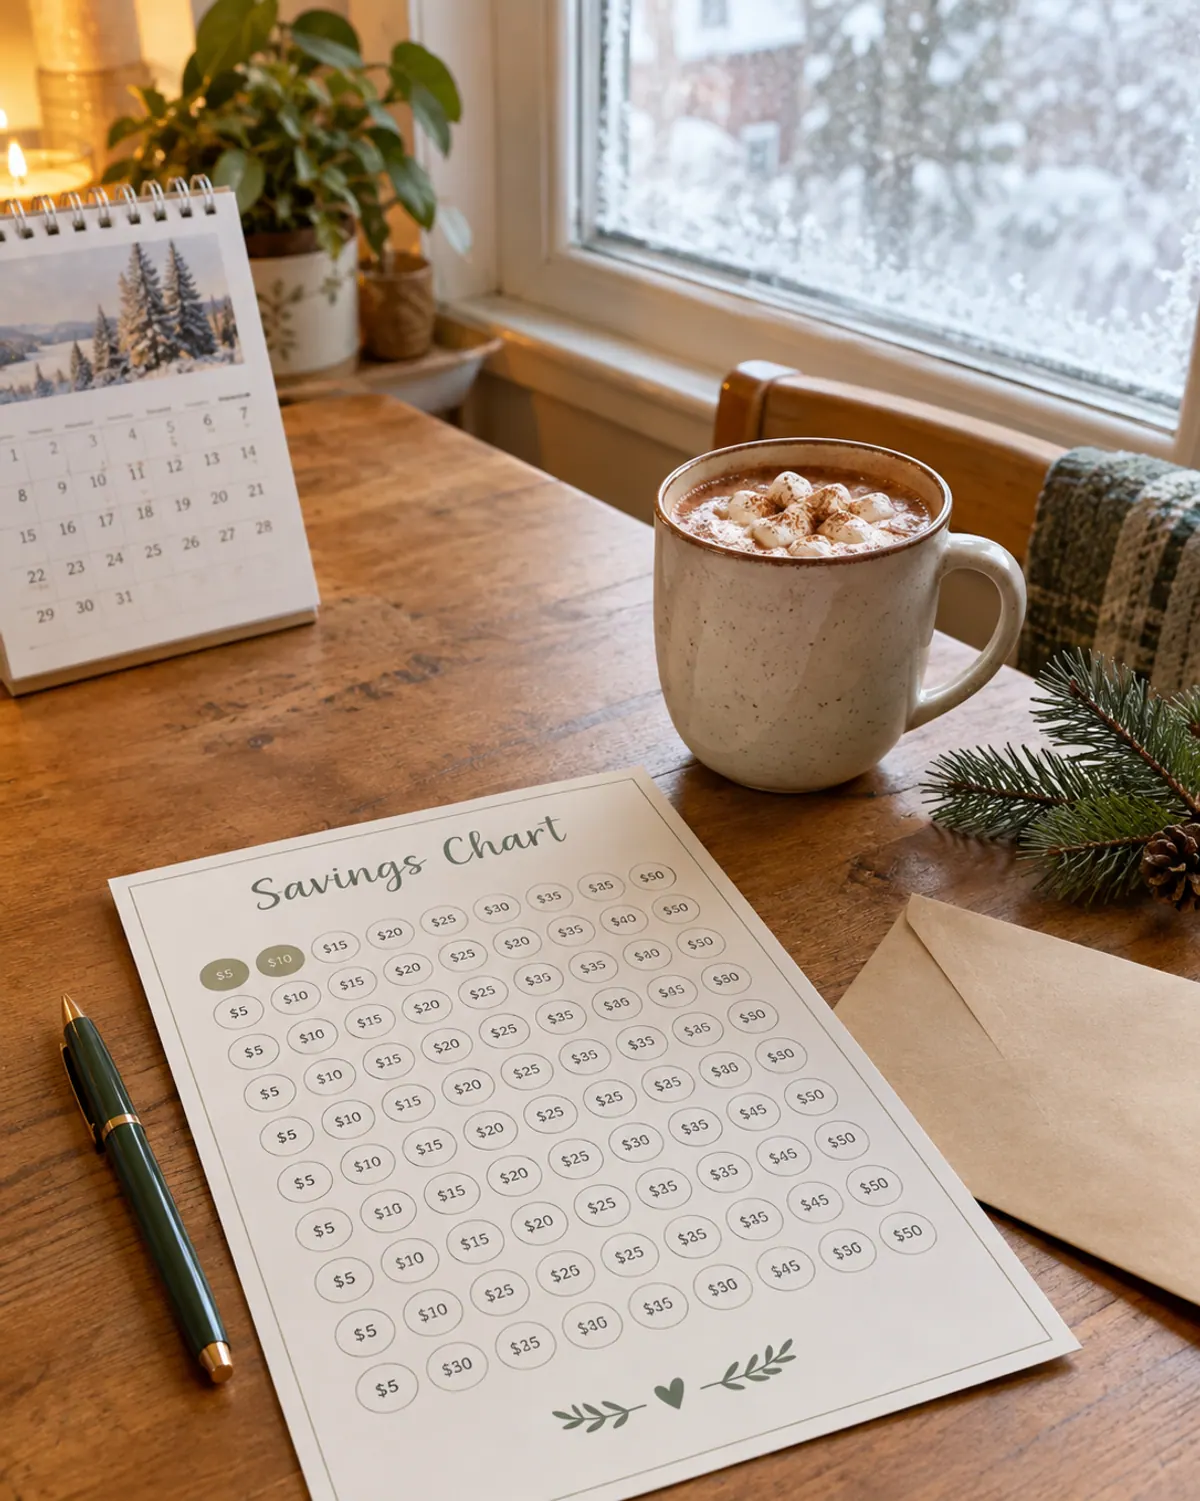
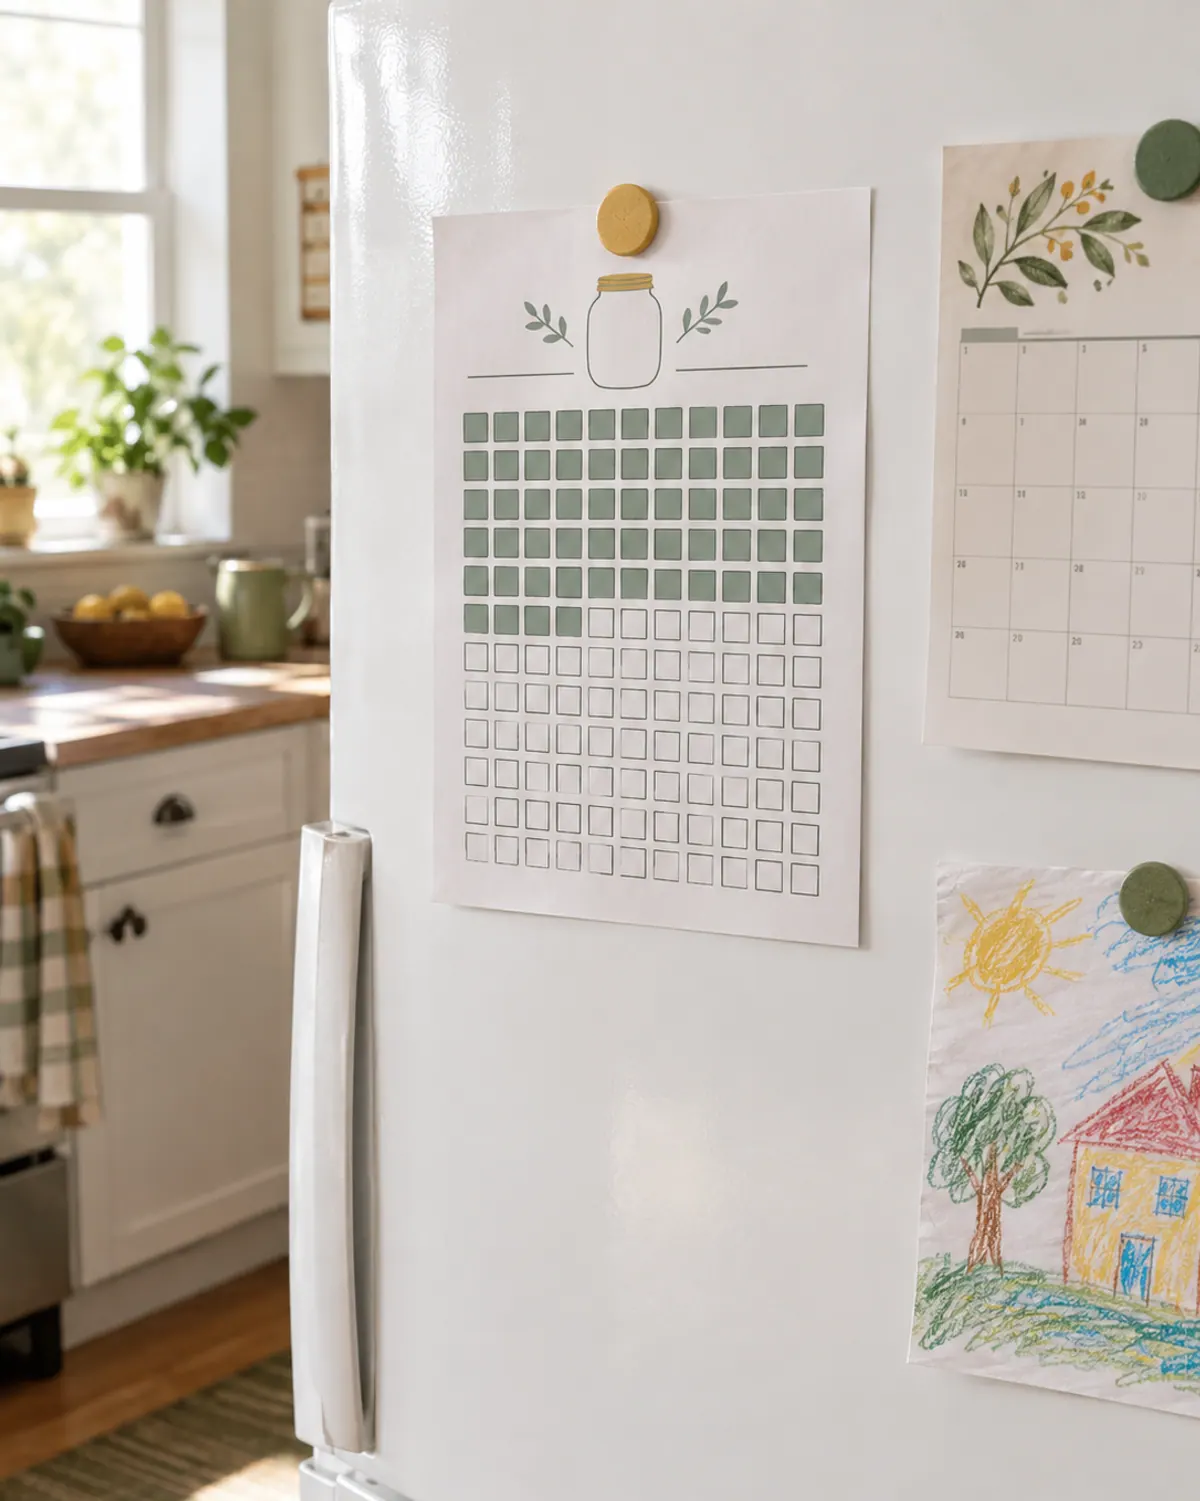
You can also use the "pick any box" method: print the chart and color in whichever amount fits that week. Tight week? Pick $3. Good week? Pick $48. Once every box is filled, you hit the same $1,378.
Bi Weekly Savings Challenge Chart ($1,755)
If you are paid every two weeks, a bi weekly chart lines up with your actual paydays. The version below starts at $5 and adds $5 each paycheck, ending at $130.
The math: 1 + 2 + 3 all the way to 26 equals 26 x 27 / 2 = 351, and 351 x $5 = $1,755. For the $10 step version, it's 351 x $10 = $3,510.
| Paycheck | Save | Total | Paycheck | Save | Total |
|---|---|---|---|---|---|
| 1 | $5 | $5 | 14 | $70 | $525 |
| 2 | $10 | $15 | 15 | $75 | $600 |
| 3 | $15 | $30 | 16 | $80 | $680 |
| 4 | $20 | $50 | 17 | $85 | $765 |
| 5 | $25 | $75 | 18 | $90 | $855 |
| 6 | $30 | $105 | 19 | $95 | $950 |
| 7 | $35 | $140 | 20 | $100 | $1,050 |
| 8 | $40 | $180 | 21 | $105 | $1,155 |
| 9 | $45 | $225 | 22 | $110 | $1,265 |
| 10 | $50 | $275 | 23 | $115 | $1,380 |
| 11 | $55 | $330 | 24 | $120 | $1,500 |
| 12 | $60 | $390 | 25 | $125 | $1,625 |
| 13 | $65 | $455 | 26 | $130 | $1,755 |
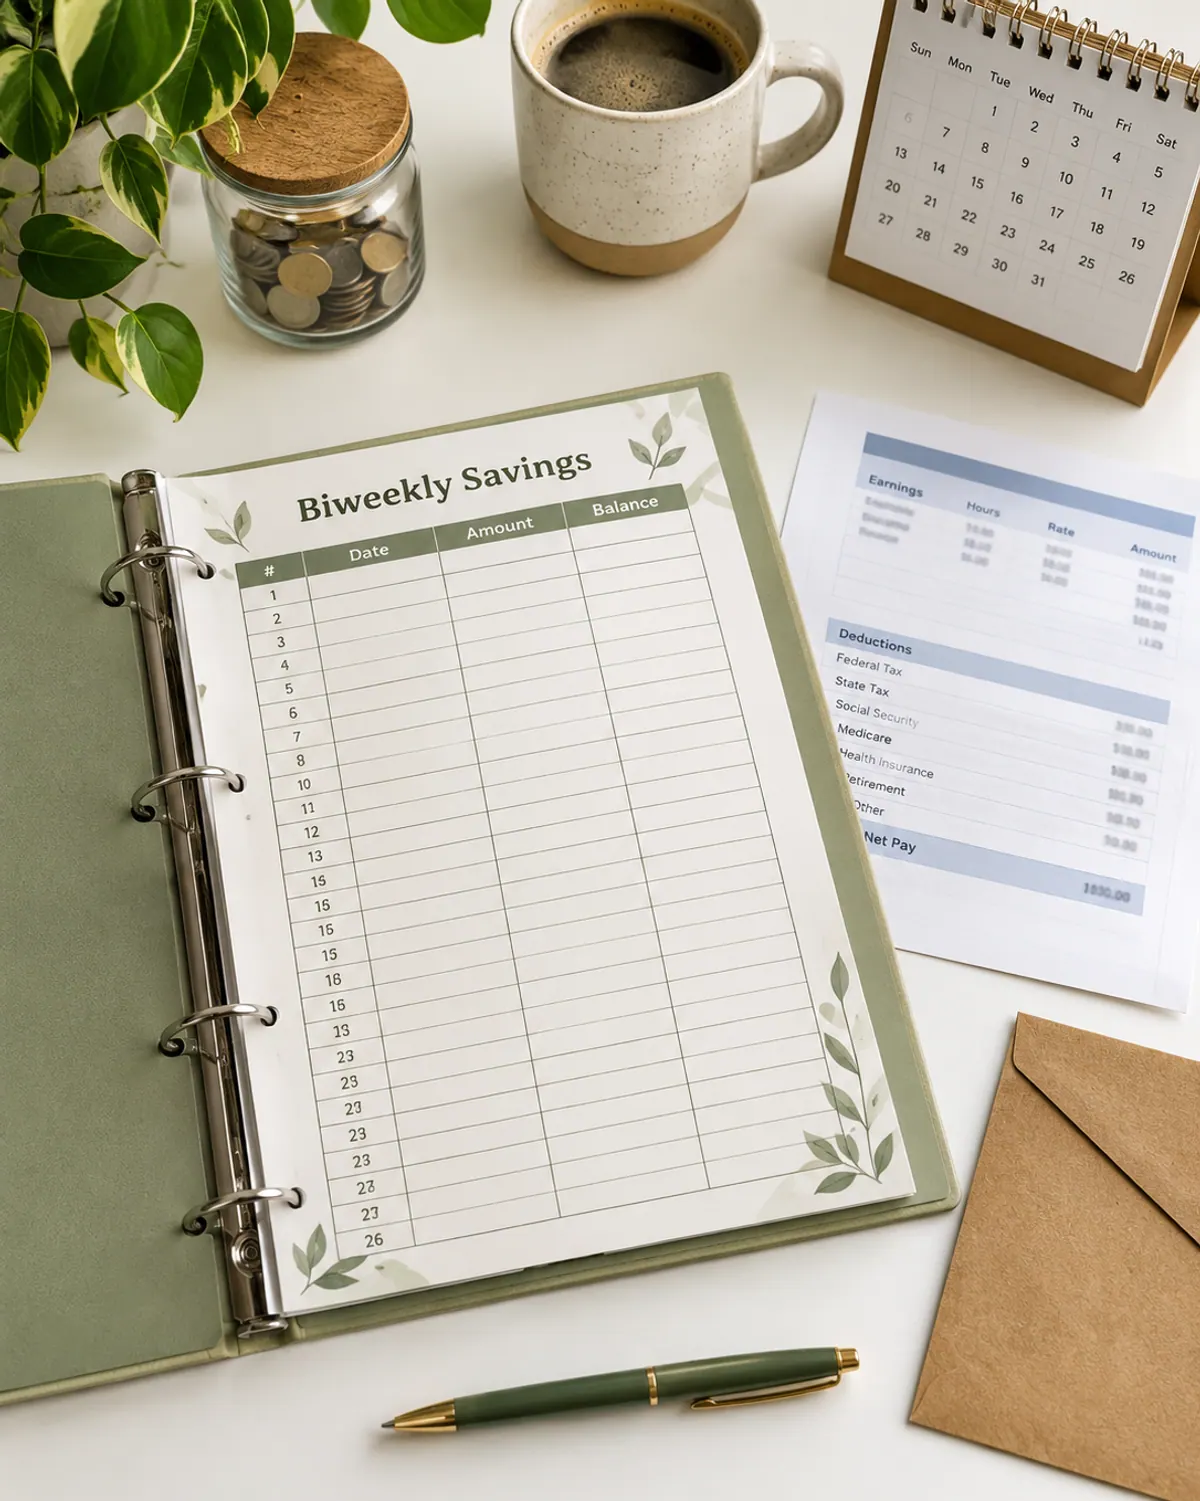
A simpler option is a flat amount every payday. $50 per paycheck x 26 paychecks = $1,300, and the amount never jumps.
Some years have 27 bi weekly paydays, depending on your employer's schedule. If yours does, add a bonus box for the extra check.
$10K Savings Challenge Printable Math
A $10K savings challenge is a big goal, so it helps to see the real amount per paycheck before you commit. Here's the honest breakdown.
| Timeline | Math | Amount each time |
|---|---|---|
| 1 year, weekly | $10,000 / 52 weeks | $192.31 |
| 1 year, bi weekly | $10,000 / 26 paychecks | $384.62 |
| 1 year, monthly | $10,000 / 12 months | $833.33 |
| 2 years, weekly | $10,000 / 104 weeks | $96.15 |
| 2 years, bi weekly | $10,000 / 52 paychecks | $192.31 |
| 100 box grid | 100 boxes x $100 each | $100 per box, any pace |

For many families, $192 a week isn't realistic, and that's okay. Spreading it over two years cuts it to about $96.15 a week, or you can use a 100 box grid where each box is $100 and fill them at your own pace.
If $10,000 is out of reach for now, the 100 envelope challenge gets you to $5,050 with smaller, flexible amounts. That's the version in our free pack below.
How to Print and Use Your Chart
-
Step 1: Choose one chart
Pick the version whose biggest deposit you could actually make in a hard month. You can always start a second chart later.
-
Step 2: Print it
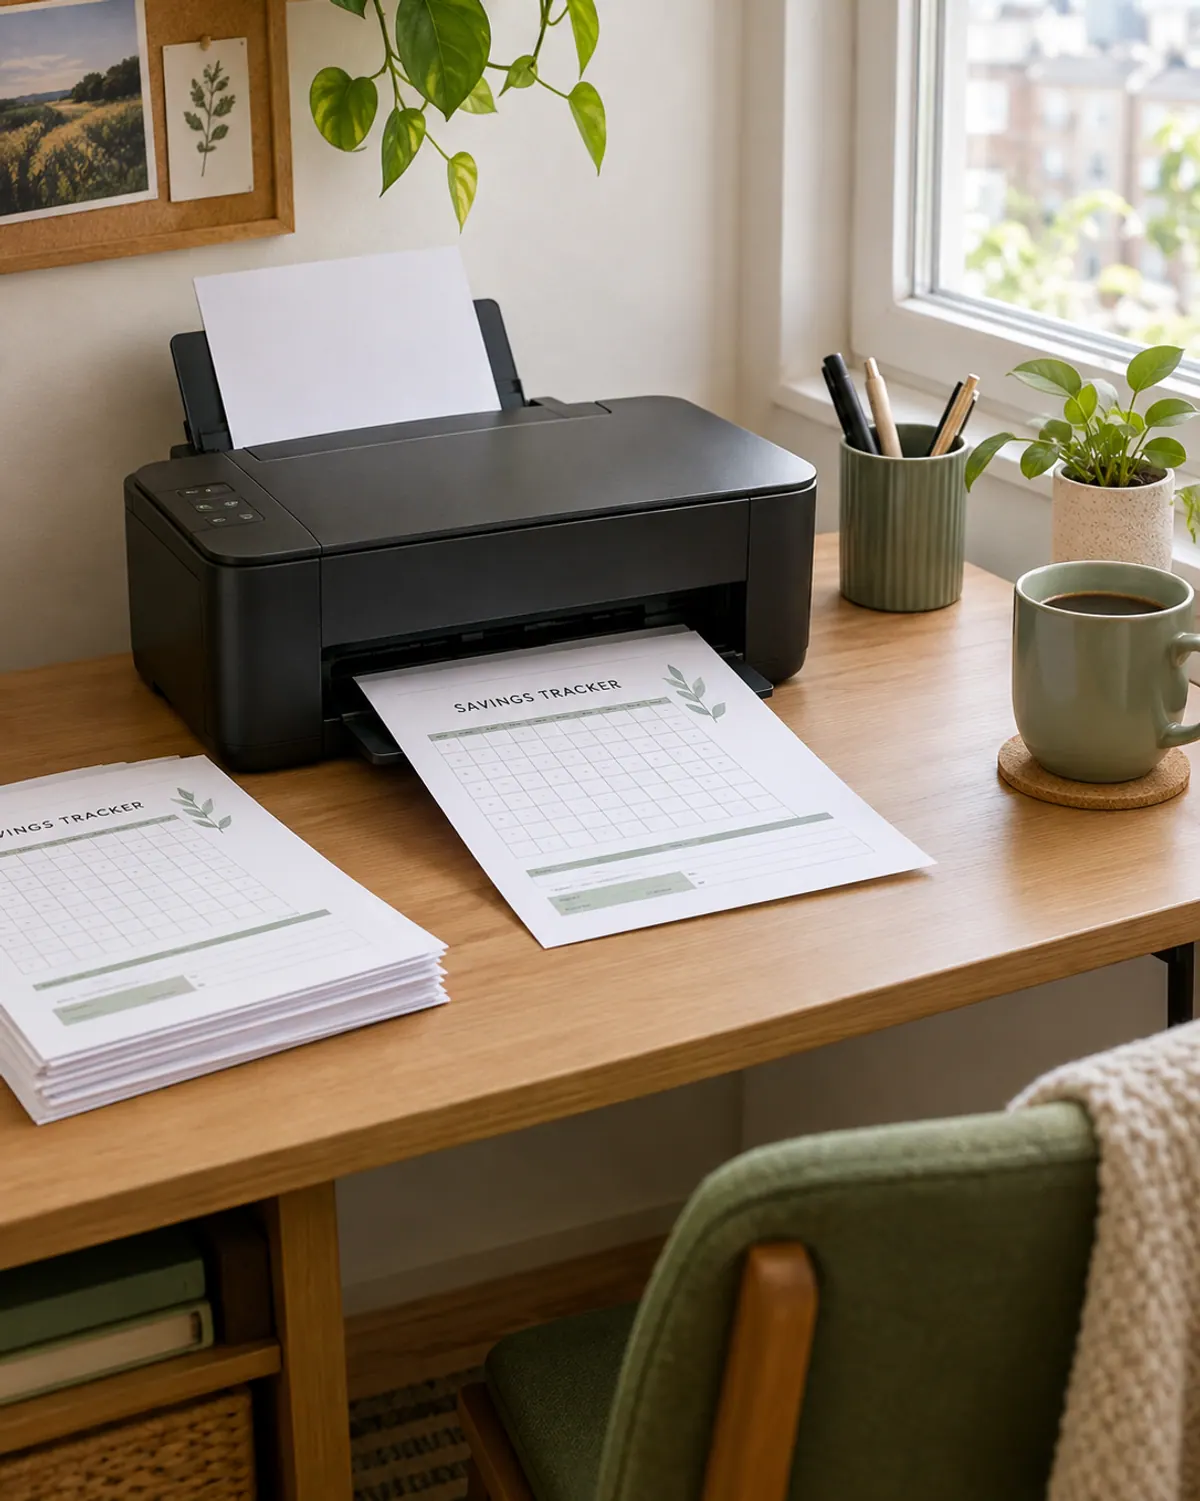
Use your browser's print option on this page, or grab the free pack. Plain printer paper is fine; cardstock lasts longer on the fridge.
-
Step 3: Set your savings spot
Decide where the money lives: a jar, cash envelopes or a separate savings account. Keeping it apart from everyday spending makes it harder to dip into.
-
Step 4: Pick a money day
Match it to payday or one set day of the week. Move the money first, then color the box.
-
Step 5: Check the running total
Once a month, compare your real balance with the chart's total column so small misses don't pile up.
Cash Envelopes, Jars or a Savings Account?
Cash makes progress feel real. An A6 binder with cash envelopes, or a big jar on the counter, lets you see the stack grow.
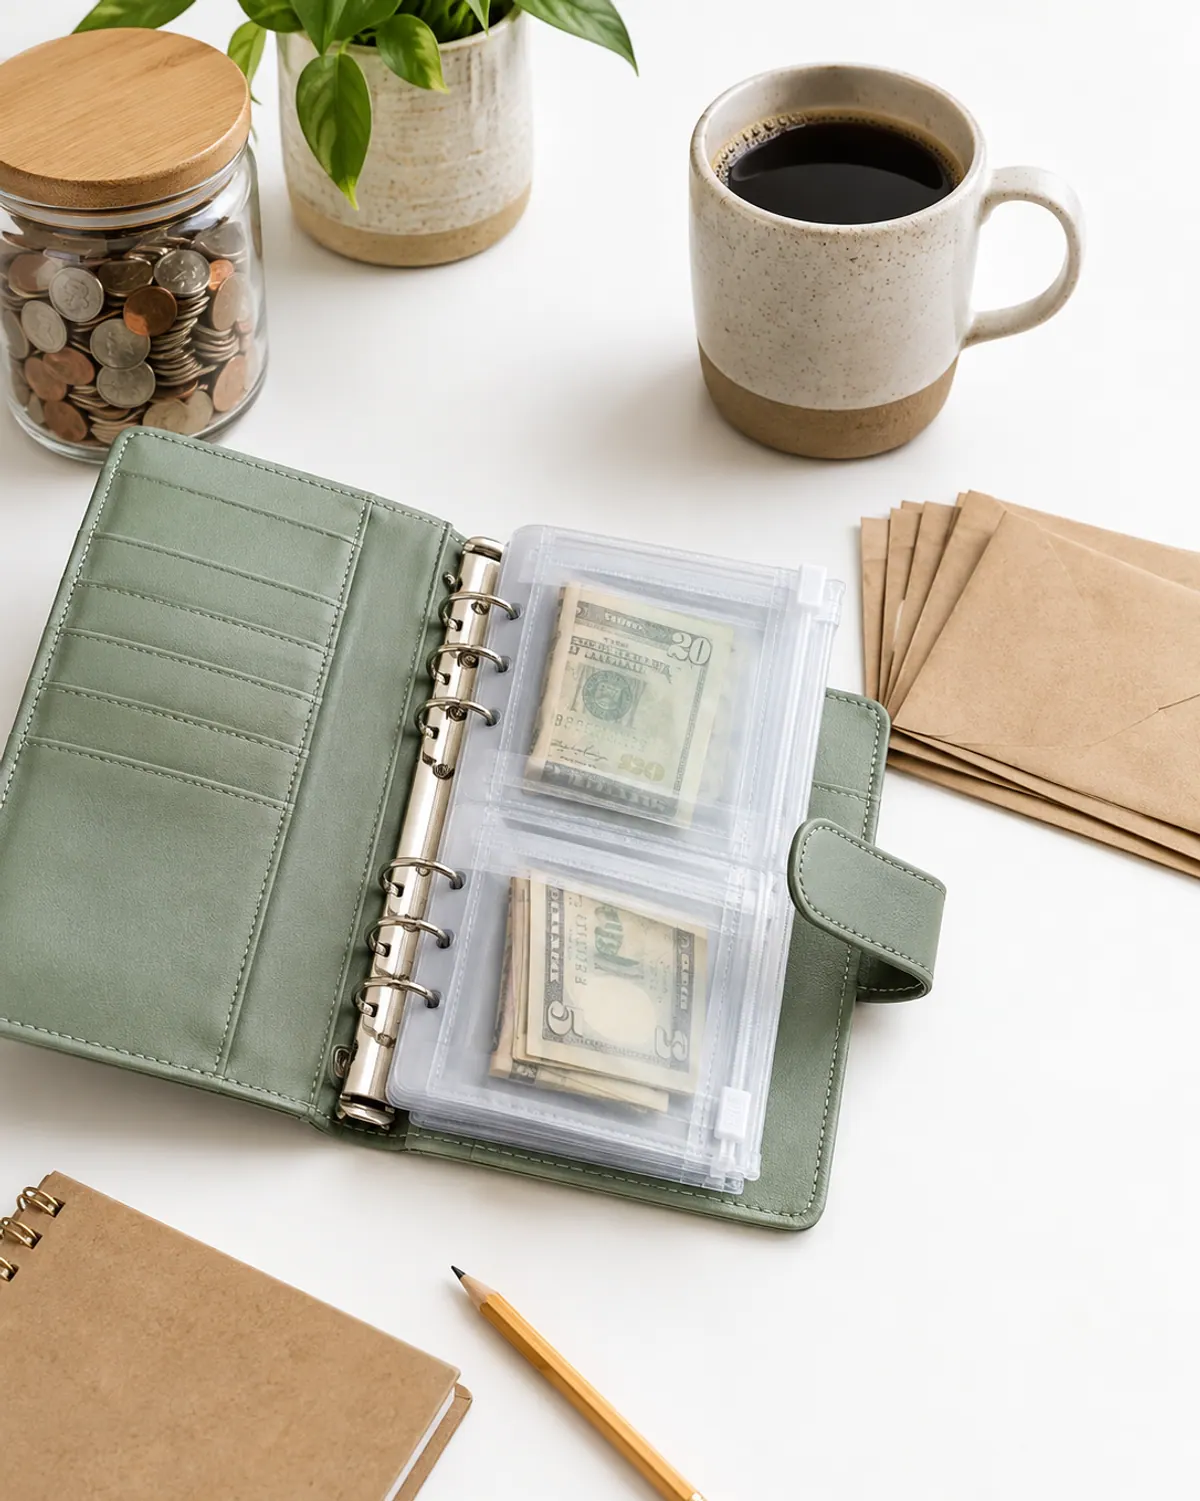
The downside is that cash at home earns nothing and can be lost or borrowed. Some people use cash for the first few months, then move it to a separate savings account.

If you use a bank, a separate high-yield savings account keeps the money apart and may earn some interest. At FDIC-insured banks, deposits are insured up to $250,000 per depositor, per bank, per ownership category. Compare fees and rates yourself, since they change often.

Handy supplies for savings challenges
-
A6 budget binder with cash envelopes
$10 to $20
Keeps cash, the chart and a pen together in one small binder.
Check price on Amazon for A6 budget binder with cash envelopes -
Pastel highlighters
$6 to $12
Coloring in boxes is half the fun of a savings challenge.
Check price on Amazon for Pastel highlighters -
Clear plastic sheet protectors
$5 to $10
Use a dry erase marker on top and reuse the same chart.
Check price on Amazon for Clear plastic sheet protectors -
Large glass savings jar
$8 to $15
A visible spot for coins and small bills.
Check price on Amazon for Large glass savings jar
Tips to Finish Your Savings Challenge
Find the money first. The easiest deposits come from money you already stopped spending. Our ways to save money fast before the holidays list has 30 ideas, and a $50 grocery list on a budget can free up a deposit or two each month.
Use meal savings. Swapping two takeout nights for cheap meals on a budget can cover several early weeks of the chart.
Plan for the holidays. If you start now, decide ahead how December fits in. Our Christmas on a budget guide helps keep gift spending from eating the chart.

Missed a week? Don't restart. Double up next time, pick a smaller box or stretch the chart a few weeks. Finishing late still counts.
Savings challenge starter checklist

Get the Free 100 Envelope Savings Challenge Pack
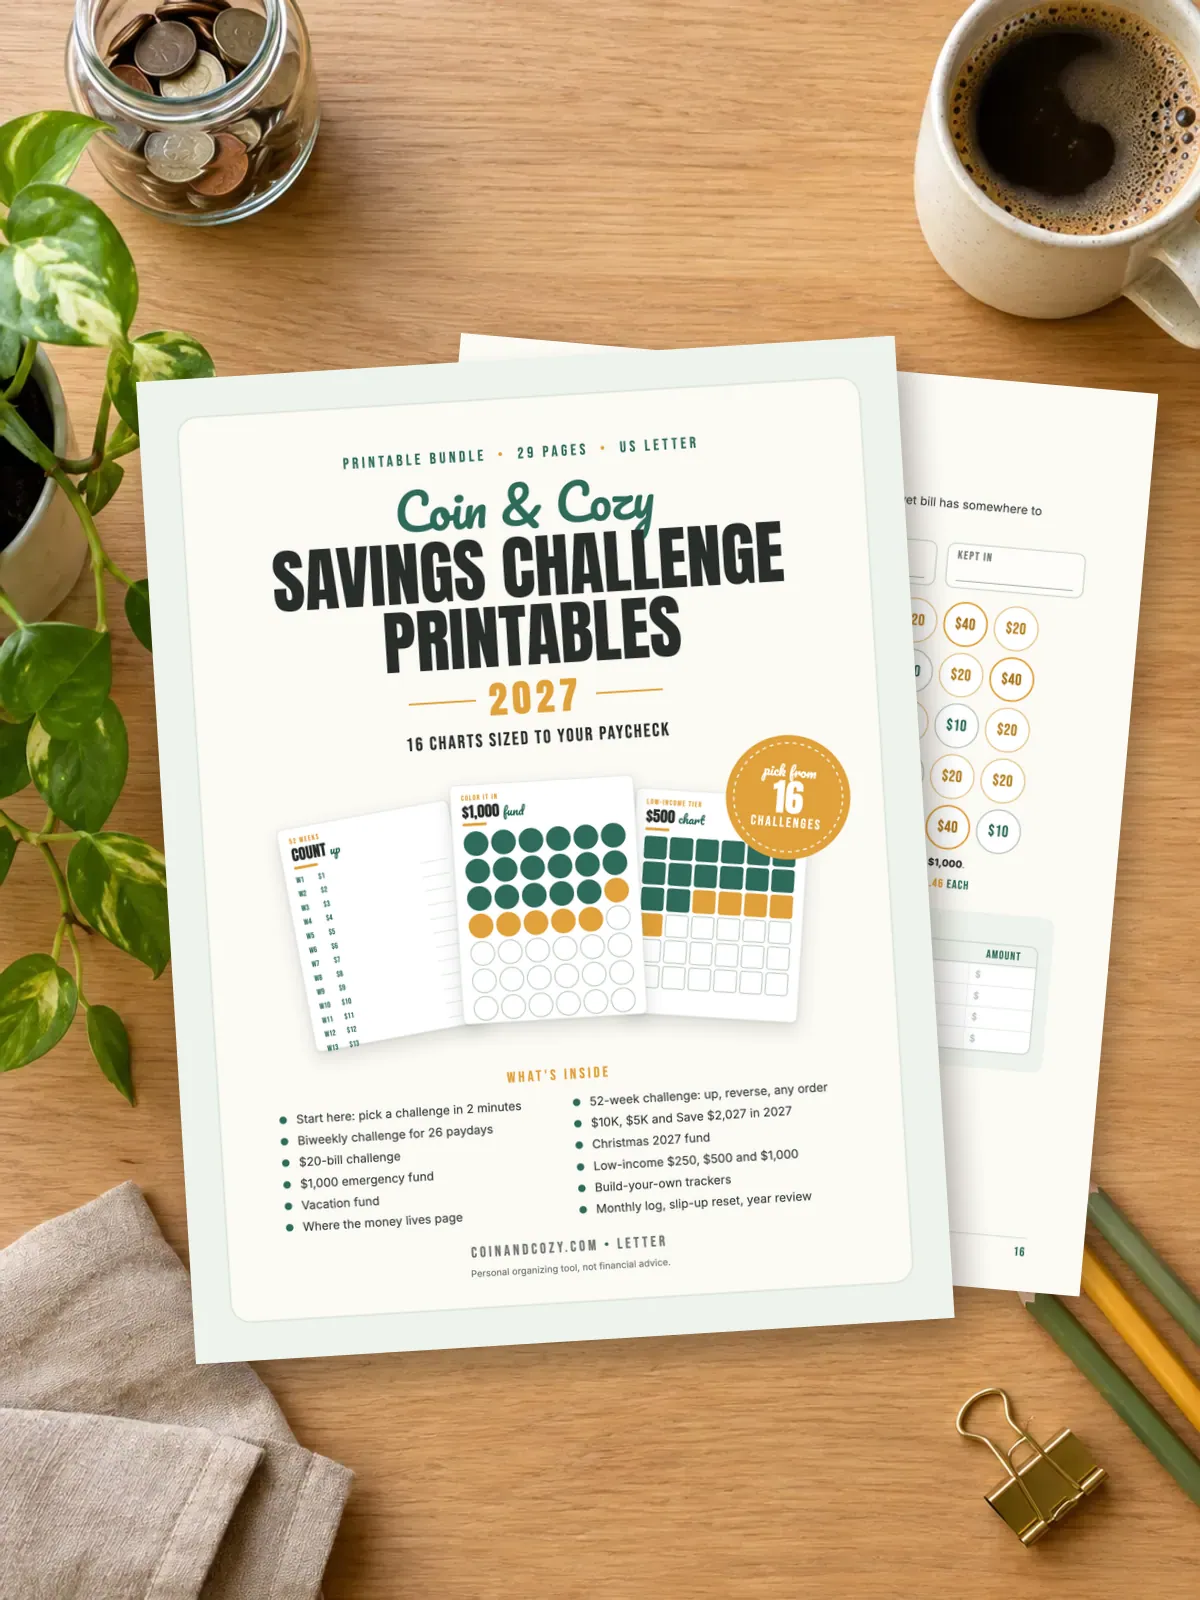
Want something ready to print? Our free pack includes the 100 envelope chart ($1 to $100 = $5,050), a 50 envelope chart ($1,275), a 30 day no-spend tracker, a goal thermometer and a blank chart for building your own challenge.
Start with one chart and one box this week. Small deposits really do add up when the chart keeps you honest.
Frequently asked questions
How much do you save with the 52 week savings challenge?
$1,378. You save $1 in week 1, $2 in week 2 and so on up to $52, and 1 + 2 + ... + 52 = 52 x 53 / 2 = 1,378. The half size version saves $689 and the double version saves $2,756.
How does a bi weekly savings challenge work?
You save on each payday instead of each week. Adding $5 more every paycheck, from $5 to $130, saves $1,755 over 26 paychecks. A flat $50 per paycheck saves $1,300.
How much a week is the $10K savings challenge?
About $192.31 a week for one year ($10,000 / 52), $384.62 per bi weekly paycheck or $833.33 a month. Over two years it drops to about $96.15 a week. These are example numbers, not financial advice.
Where are the free savings challenge printables?
Every chart on this page prints from your browser. The free 100 envelope savings challenge pack adds the 100 envelope chart, a 50 envelope chart, a no-spend tracker, a goal thermometer and a blank chart.
What if I miss a week of my savings challenge?
Keep going. Double up on the next deposit, pick a smaller box using the any-box method or add a few weeks to the end. Finishing late still gets you the full total.
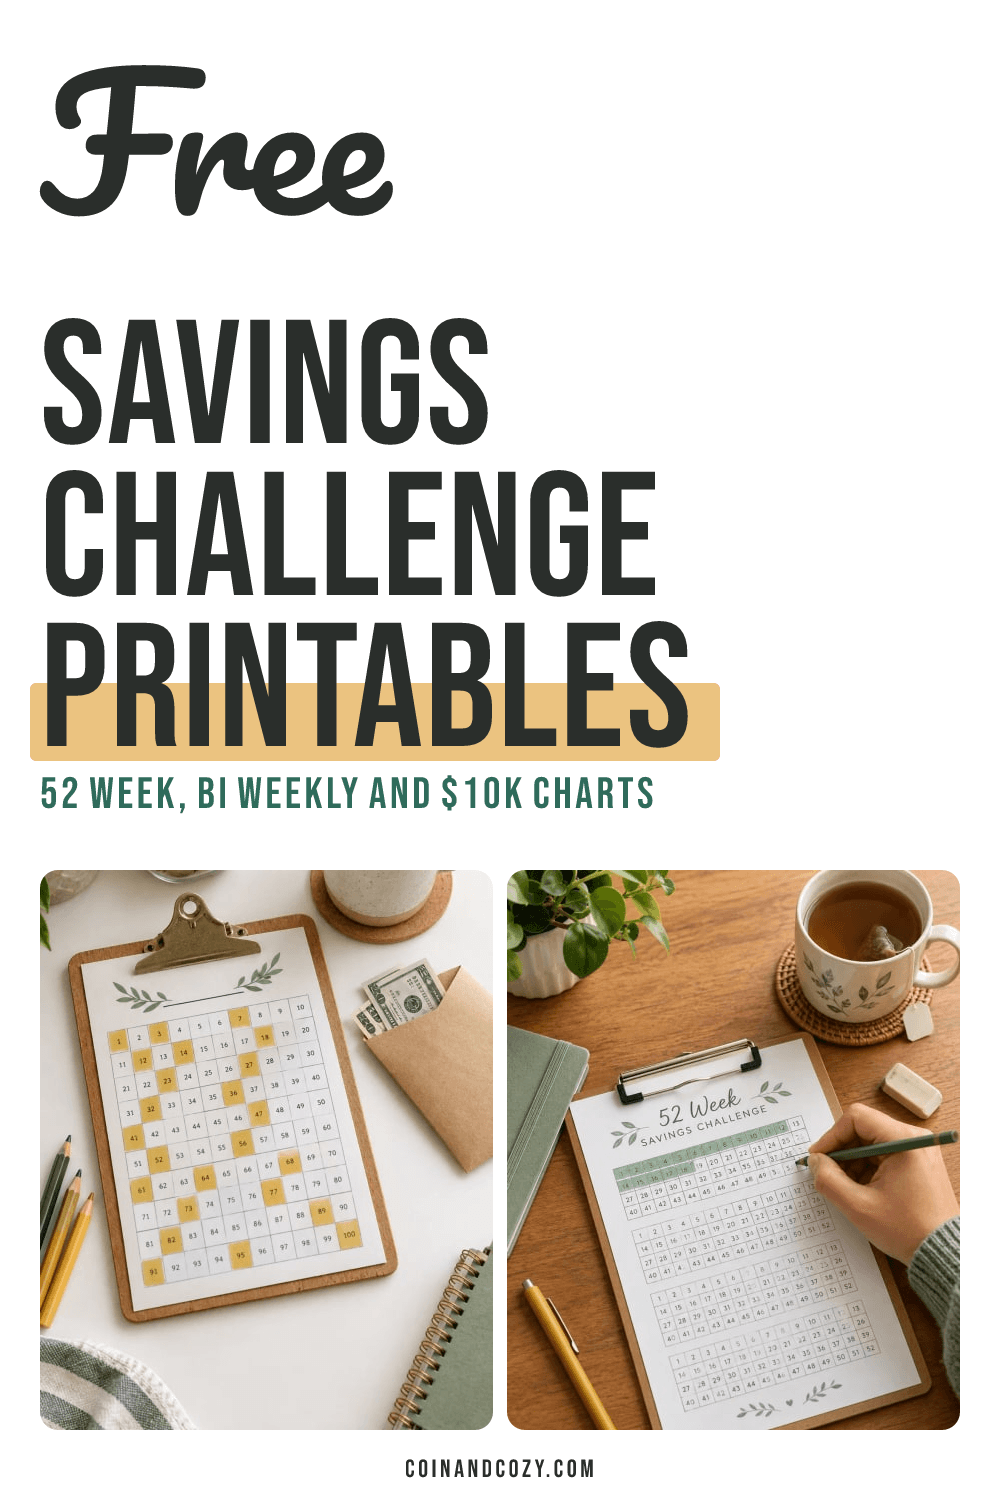
Save it for later
Pin this to your Savings Challenges board so it's there when you need it.
Save to Pinterest